
- Americans moving to the country’s biggest metros are mainly searching for better quality housing and better neighborhoods.
- Gen Xers are the country’s most mobile generation, making up 40% of all the people moving to large urban centers, while Millennials represent only 32%, despite the fact that the Millennial generation is more numerous and obviously younger than Gen X, and might be expected to move at a higher rate.
- The southern metros – Dallas-Fort Worth-Arlington, Phoenix-Mesa-Scottdale, and Houston-The Woodlands-Sugar Land – are the big gainers in terms of population change.
- The biggest losers in terms of population change are the Chicago-Naperville-Elgin, New-York-Newark-Jersey City and Los Angeles-Long Beach-Anaheim metros.
Mobility in the US might be on a descending trend, but a sizable proportion of Americans still move every year, which has significant implications for local economies and urban dynamics.
Considering the huge impact that the moving industry has on the self-storage sector, we here at StorageCafe identified the country’s most dynamic cities in terms of inbound migration and also looked at population changes, in order to see the major migration patterns within the US and find out whether the housing and self-storage sectors are adjusting to those patterns.
We analyzed migration data in the country’s 389 metros and ranked the 100 biggest metros for inbound migration. For each of them, we also determined the actual population change. When it comes to migration patterns, we couldn’t help but notice that the top ten metros for inbound migration account for a significant chunk of the people moving around the United States. Of the 25 million people who moved from anywhere in the US to a metro in 2017, almost 2.8 million, or 11%, headed towards one of those top 10 metros.
The US Metros that Attract the Biggest Crowds: New York Remains Top Destination for Inbound Migration
Inbound migration is a measuring tool indicative of the appeal that each metro projects, both throughout the country and into the wider world beyond. Obviously, beside the in-flow of population there’s also outbound migration. We looked at the number of people moving away from said metros, and the net change – how many residents each metro gained or lost. Both metrics are highlighted in the table attached to this research.
The metro area with the highest inbound migration is New York-Newark-New Jersey, with 417,186 newcomers in 2017, followed by Los Angeles-Long Beach-Anaheim with 359,000. The bronze medal goes to Washington-Arlington-Alexandria, with almost 300,000 new residents arriving in the year.
[desktoponly]
Use the code below to embed the image on your website:
[/desktoponly] [mobileonly]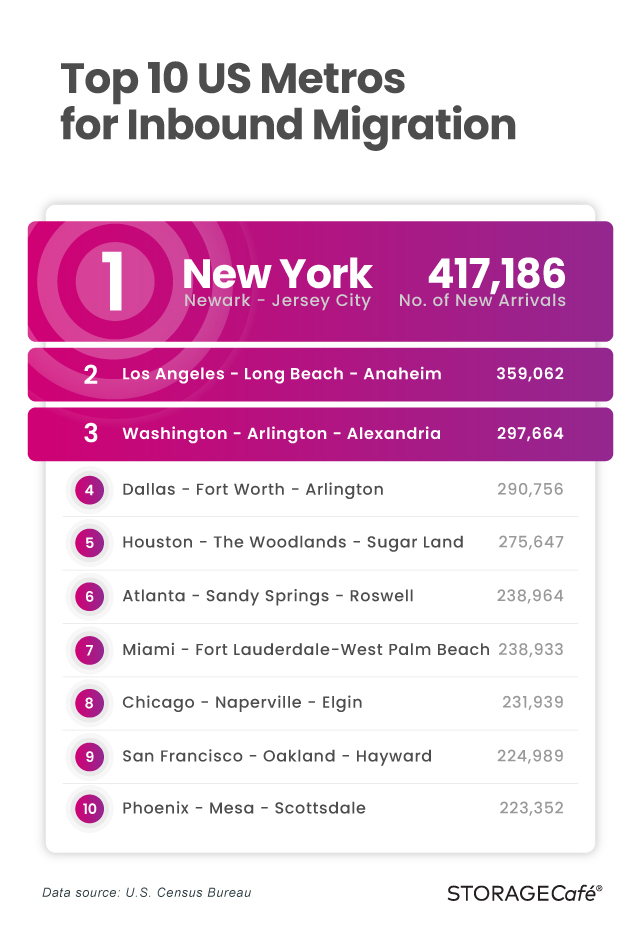 [/mobileonly]
Texas continues to have nationwide appeal: the following two spots in the list of top 10 metros for inbound migration belong to the Lone Star State, namely Dallas-Fort Worth-Arlington, with 290,000 people moving here in 2017, and Houston-The Woodlands-Sugar Land, with 275,000. The Atlanta-Sandy Springs-Roswell metro and Miami-Fort Lauderdale follow on spots six and seven, with about 238,000 new arrivals each, separated by only a few dozen people.
Eighth in line is Chicago-Naperville-Elgin, which received about 231,000 new residents in one year, followed by San Francisco-Oakland-Hayward, which attracted 224,000 new residents. The Top 10 metros by inbound migration list closes with Phoenix-Mesa-Scottsdale, at the receiving end of 223,000 newcomers.
Where Are the Movers Coming From?
It’s no secret that the US has worldwide appeal. More than that, the primary source of new residents for the top 10 metros for inbound migration is from outside the continental US.
The New York, Los Angeles and Washington metro areas all have Asian countries, mainly China and India, as their top source of new arrivals. New York-Newark-New Jersey welcomed more than 67,000 Asian newcomers in 2017, the most of all metros, followed by Los Angeles-Long Beach-Anaheim with almost 58,000 and Washington-Arlington-Alexandria with almost 33,000. The other two metros that have Asia as the main source of new residents are San Francisco-Oakland-Hayward with almost 30,000, and Chicago-Naperville-Elgin with about 27,000.
One metro, Miami-Fort Lauderdale-West Palm Beach, has the Caribbean region as its top source of new arrivals – over 32,000 people. The remaining four metro areas in the Top 10 – Dallas-Fort Worth-Arlington, Houston-The Woodlands-Sugar Land, Atlanta-Sandy Springs-Roswell and Phoenix-Mesa-Scottsdale – have outside metro areas within US or Puerto Rico as their main source of incoming migration.
Domestic Migration Trends: Philadelphians Flock to New York and New Yorkers Flee to the South
When looking into the primary continental US sources of new residents for the 10 metros, one pattern becomes apparent very fast: generally, the newcomers to most of the metros are coming from another, close-by metro area.
For example, the New York-Newark-New Jersey metro gets most of its domestic movers – about 18,000 in 2017 – from the Philadelphia-Camden-Wilmington area. The same trend can be seen in the case of Los Angeles-Long Beach-Anaheim: its number one domestic source of incoming migration is the adjacent Riverside-San Bernardino-Ontario metro, with almost 45,000 people relocating from there to LA Metro in 2017.
The Dallas-Fort Worth-Arlington and Houston-The Woodlands-Sugar Land metros are more or less switching people back and forth. Each is the other’s main source of domestic migration, and even the numbers are pretty similar – 15,300 people from Houston metro moved to Dallas metro, while about 16,300 moved the opposite way in 2017.
The pattern loses its validity in just three out of the 10 metros: Atlanta-Sandy Springs-Roswell, Miami-Fort Lauderdale-West Palm Beach and Chicago-Naperville-Elgin. For those metros, the main domestic migration contributor is the same, none other than the New York-Newark-Jersey City metro area. Almost 12,700 New Yorkers took up residence in Atlanta, about 24,000 moved to Miami and 7,200 moved to Chicago.
Who’s Actually Gaining and Who’s Losing: Population Change in the Biggest US Metros
The fact that three of the 10 metros considered for this study have the New York metro as the main source for their inbound migration is not mere coincidence. New York is the most attractive US metro area, judging by inbound migration, which emphasizes the magnetic appeal the Big Apple is projecting throughout the country and the wider world.
However, the huge metropolis, boasting a 20-million population, is also losing residents at an ever-faster pace, which is not at all surprising considering its sheer size and the challenges one faces while living in such an area: access to housing, living costs, and transportation. The fact that New York is losing more residents than it is gaining is, probably, rather good news for most New Yorkers. The population change in 2017 was a negative 19,500 for the New York-Newark-New Jersey metro.
The other two metro areas in this list that registered population losses are the Chicago-Naperville-Elgin metro – taking the crown for the most people lost, 22,000 – and Los Angeles-Long Beach-Anaheim, which decreased by 7,000 people.
At the other end of the spectrum, Dallas-Fort Worth-Arlington had a population growth of more than 130,000, followed by Houston-The Woodlands-Sugar Land with 91,000 and Atlanta-Sandy Springs-Roswell with almost 76,000 people.
Population Change in Top 100 Metros
| No. | Metro Name | State | # Population Change Y-o-Y | % Population Change Y-o-Y | Total Population |
|---|---|---|---|---|---|
| 1 | Dallas-Fort Worth-Arlington | TX | 131,767 | -0.10% | 7,539,711 |
| 2 | Phoenix-Mesa-Scottsdale | AZ | 96,268 | -0.10% | 4,857,962 |
| 3 | Houston-The Woodlands-Sugar Land | TX | 91,689 | -0.20% | 6,997,384 |
| 4 | Atlanta-Sandy Springs-Roswell | GA | 75,702 | 1.80% | 5,949,951 |
| 5 | Orlando-Kissimmee-Sanford | FL | 60,045 | 1.30% | 2,572,962 |
| 6 | Seattle-Tacoma-Bellevue | WA | 54,894 | 0.80% | 3,939,363 |
| 7 | Austin-Round Rock | TX | 53,086 | 0.80% | 2,168,316 |
| 8 | Riverside-San Bernardino-Ontario | CA | 51,934 | 0.30% | 4,622,361 |
| 9 | Tampa-St. Petersburg-Clearwater | FL | 51,438 | 1.30% | 3,142,663 |
| 10 | Washington-Arlington-Alexandria | DC-VA-MD-WV | 49,949 | 0.60% | 6,249,950 |
| 11 | Miami-Fort Lauderdale-West Palm Beach | FL | 49,095 | 2% | 6,198,782 |
| 12 | Las Vegas-Henderson-Paradise | NV | 48,337 | 0.40% | 2,231,647 |
| 13 | Charlotte-Concord-Gastonia | NC-SC | 44,350 | 1.10% | 2,569,213 |
| 14 | San Antonio-New Braunfels | TX | 43,762 | 0.10% | 2,518,036 |
| 15 | Denver-Aurora-Lakewood | CO | 39,436 | 1.40% | 2,932,415 |
| 16 | Minneapolis-St. Paul-Bloomington | MN-WI | 36,521 | 1% | 3,629,190 |
| 17 | Boston-Cambridge-Newton | MA-NH | 30,793 | 0.50% | 4,875,390 |
| 18 | Nashville-Davidson-Murfreesboro-Franklin | TN | 30,377 | -3.90% | 1,930,961 |
| 19 | Jacksonville | FL | 29,860 | 1.70% | 1,534,701 |
| 20 | Raleigh | NC | 28,198 | 1.40% | 1,362,540 |
| 21 | Sacramento-Roseville-Arden-Arcade | CA | 24,829 | 0% | 2,345,210 |
| 22 | Columbus | OH | 24,066 | 0.20% | 2,106,541 |
| 23 | Portland-Vancouver-Hillsboro | OR-WA | 22,348 | 2.40% | 2,478,810 |
| 24 | Lakeland-Winter Haven | FL | 22,179 | 1.80% | 708,009 |
| 25 | Indianapolis-Carmel-Anderson | IN | 21,980 | 1.80% | 2,048,703 |
| 26 | Boise City | ID | 20,346 | 0.90% | 730,426 |
| 27 | San Francisco-Oakland-Hayward | CA | 18,791 | 1.10% | 4,729,484 |
| 28 | Philadelphia-Camden-Wilmington | PA-NJ-DE-MD | 17,921 | -0.20% | 6,096,372 |
| 29 | San Diego-Carlsbad | CA | 17,896 | 2.20% | 3,343,364 |
| 30 | Salt Lake City | UT | 17,302 | 0.50% | 1,222,540 |
| 31 | North Port-Sarasota-Bradenton | FL | 16,434 | 2.50% | 821,573 |
| 32 | Kansas City | MO-KS | 16,392 | 0.80% | 2,143,651 |
| 33 | Provo-Orem | UT | 16,017 | 1.20% | 633,768 |
| 34 | Cape Coral-Fort Myers | FL | 15,104 | -0.10% | 754,610 |
| 35 | Colorado Springs | CO | 13,501 | 1.10% | 738,939 |
| 36 | Richmond | VA | 13,261 | -3.90% | 1,306,172 |
| 37 | Oklahoma City | OK | 13,196 | 0.30% | 1,396,445 |
| 38 | Charleston-North Charleston | SC | 12,554 | 1.60% | 787,643 |
| 39 | Tucson | AZ | 11,571 | 0.20% | 1,039,073 |
| 40 | Deltona-Daytona Beach-Ormond Beach | FL | 11,488 | 0.30% | 659,605 |
| 41 | Greenville-Anderson-Mauldin | SC | 11,204 | 0.10% | 906,626 |
| 42 | Ogden-Clearfield | UT | 10,478 | 2% | 675,067 |
| 43 | Cincinnati | OH-KY-IN | 10,351 | 1% | 2,190,209 |
| 44 | Des Moines-West Des Moines | IA | 10,309 | 2.10% | 655,409 |
| 45 | Stockton-Lodi | CA | 10,144 | 0.20% | 752,660 |
| 46 | Omaha-Council Bluffs | NE-IA | 9,981 | 1% | 942,198 |
| 47 | Spokane-Spokane Valley | WA | 9,535 | 0.30% | 573,493 |
| 48 | Grand Rapids-Wyoming | MI | 9,079 | 0% | 1,069,405 |
| 49 | Durham-Chapel Hill | NC | 8,921 | 1.40% | 575,412 |
| 50 | Palm Bay-Melbourne-Titusville | FL | 8,584 | 0% | 596,849 |
| 51 | Fresno | CA | 7,858 | 0.20% | 994,400 |
| 52 | Bakersfield | CA | 7,776 | 0% | 896,764 |
| 53 | McAllen-Edinburg-Mission | TX | 7,616 | 0% | 865,939 |
| 54 | Columbia | SC | 7,556 | 0.90% | 832,666 |
| 55 | Knoxville | TN | 7,512 | 1.10% | 883,309 |
| 56 | Madison | WI | 5,845 | 0.80% | 660,422 |
| 57 | Worcester | MA-CT | 5,563 | 0.20% | 947,866 |
| 58 | San Jose-Sunnyvale-Santa Clara | CA | 5,525 | -0.60% | 1,999,107 |
| 59 | Allentown-Bethlehem-Easton | PA-NJ | 4,832 | 0.60% | 842,913 |
| 60 | Detroit-Warren-Dearborn | MI | 4,738 | 0% | 4,326,442 |
| 61 | Winston-Salem | NC | 4,710 | 1.10% | 671,456 |
| 62 | Louisville | KY-IN | 4,492 | 0.30% | 1,297,301 |
| 63 | Providence-Warwick | RI-MA | 4,280 | 1.30% | 1,621,337 |
| 64 | Greensboro-High Point | NC | 4,225 | 0.90% | 767,711 |
| 65 | Baltimore-Columbia-Towson | MD | 4,202 | 0.90% | 2,802,789 |
| 66 | Augusta-Richmond County | GA-SC | 4,161 | 0.10% | 604,167 |
| 67 | Virginia Beach-Norfolk-Newport News | VA-NC | 3,857 | 0.90% | 1,728,733 |
| 68 | Harrisburg-Carlisle | PA | 3,558 | 0% | 574,659 |
| 69 | Little Rock-North Little Rock-Conway | AR | 3,113 | 0% | 741,104 |
| 70 | Memphis | TN-MS-AR | 3,044 | 0% | 1,350,620 |
| 71 | Albuquerque | NM | 3,030 | 0.60% | 915,927 |
| 72 | Dayton | OH | 2,835 | 0.90% | 806,548 |
| 73 | Springfield | MA | 2,255 | 0% | 631,761 |
| 74 | Tulsa | OK | 2,187 | 2% | 993,797 |
| 75 | Birmingham-Hoover | AL | 2,116 | 0.40% | 1,151,801 |
| 76 | Albany-Schenectady-Troy | NY | 1,039 | 1.60% | 883,169 |
| 77 | Milwaukee-Waukesha-West Allis | WI | 962 | 0.60% | 1,576,113 |
| 78 | Buffalo-Cheektowaga-Niagara Falls | NY | 492 | 2% | 1,130,152 |
| 79 | Akron | OH | 478 | 1.40% | 704,845 |
| 80 | El Paso | TX | 408 | 0.40% | 845,553 |
| 81 | Bridgeport-Stamford-Norwalk | CT | 366 | 1.90% | 943,823 |
| 82 | Oxnard-Thousand Oaks-Ventura | CA | 165 | 2.90% | 850,967 |
| 83 | Baton Rouge | LA | 128 | 3.20% | 831,310 |
| 84 | Wichita | KS | -61 | 0.10% | 644,888 |
| 85 | New Orleans-Metairie | LA | -66 | 1.60% | 1,270,399 |
| 86 | New Haven-Milford | CT | -174 | 0.70% | 857,620 |
| 87 | St. Louis | MO-IL | -385 | 0.90% | 2,805,465 |
| 88 | Hartford-West Hartford-East Hartford | CT | -419 | 1.80% | 1,206,300 |
| 89 | Rochester | NY | -507 | 1.60% | 1,071,082 |
| 90 | Syracuse | NY | -546 | -0.10% | 650,502 |
| 91 | Toledo | OH | -959 | 0% | 602,871 |
| 92 | Jackson | MS | -1,386 | 2.60% | 580,166 |
| 93 | Cleveland-Elyria | OH | -1,540 | 0.40% | 2,057,009 |
| 94 | Pittsburgh | PA | -5,540 | 0.70% | 2,324,743 |
| 95 | Honolulu | HI | -6,349 | -0.20% | 980,080 |
| 96 | Los Angeles-Long Beach-Anaheim | CA | -7,223 | 1.50% | 13,291,486 |
| 97 | New York-Newark-Jersey City | NY-NJ-PA | -19,474 | -0.20% | 19,979,477 |
| 98 | Chicago-Naperville-Elgin | IL-IN-WI | -22,068 | 1.60% | 9,498,716 |
| 99 | San Juan-Carolina-Caguas | PR | -81,087 | 0.60% | 2,023,237 |
| 100 | Puerto Rico | PR | -129,848 | 1.70% | 3,195,153 |
Research provided by: STORAGECafé
The Profile of Today’s American On the Move: Gen Xers Lead Domestic Migration
We went even further with our research and looked into the demographics of the 2.8 million people who moved to a metro area in 2017 to learn more about their age, gender, marital status and the reasons behind their moves. We compiled all this data and came up with a profile of today’s Americans on the move. Surprisingly enough, it’s the need for better housing, and not for jobs, that drives the most relocations.
[desktoponly] [/desktoponly] [mobileonly]
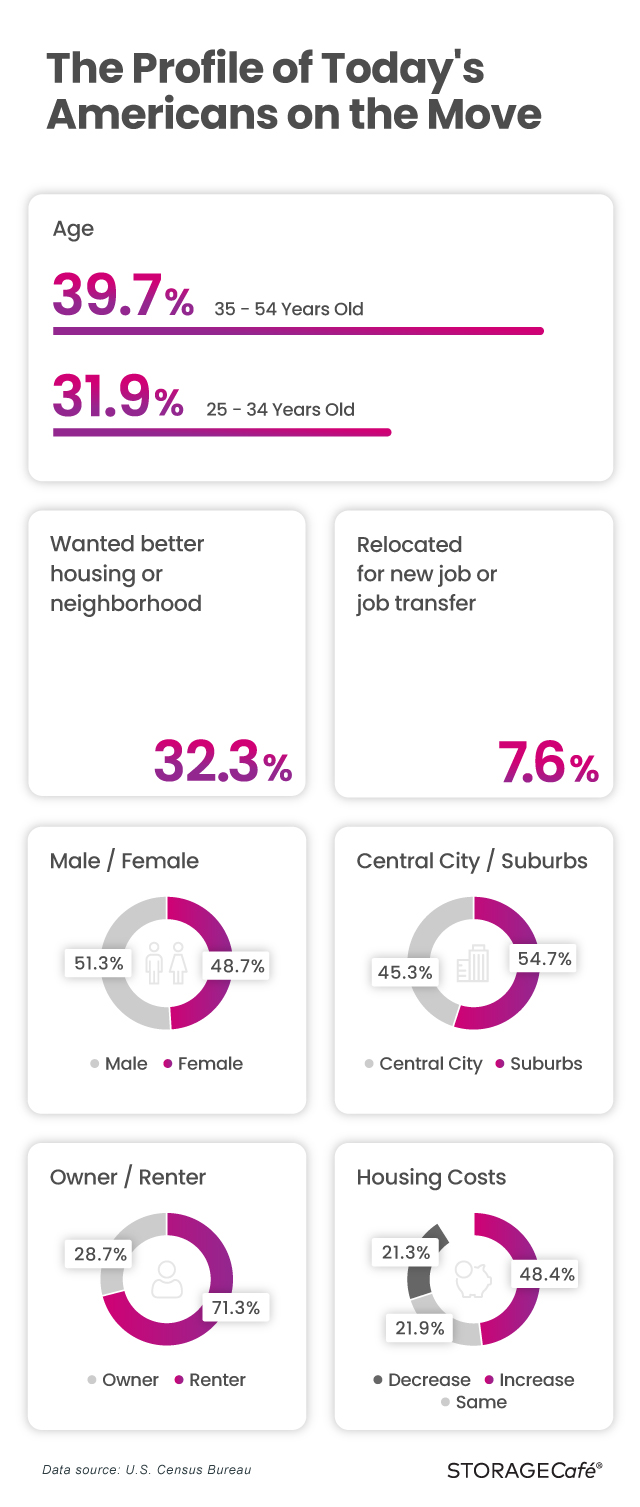 [/mobileonly]
The profile of the typical big-city dweller is predictable in some areas, but surprising in others. As you might expect, Millennials and Gen Xers form the majority of the people moving to the country’s top 10 metros. However, Gen Xers, who, so far, flew pretty much under the radar due to the intense social media wars between Millennials and Baby Boomers, are finally getting their spot in the limelight.
Gen Xers, jokingly known as the forgotten generation or the middle child generation, represent the biggest portion of Americans moving to the top 10 metro areas for inbound migration – almost 40%. The second spot belongs to Millennials, who represent a little under 32% of the metro movers.
They are followed at a great distance by Baby Boomers – less than 16% of them are uprooting their lives in order to start over in a different location. Only about 8% of the youngest generation considered in this report, Gen Z/Post Millennials, are relocating, but it’s expected the proportion will grow as more of them reach adulthood.
Chicago Vies with Miami for Winning over Members of The Silent Generation
There are some intriguing facts to pinpoint regarding the age of people choosing different metros. Miami-Fort Lauderdale-West Palm Beach attracts the lowest proportion of Gen Zs – only 4.25%. The youngest generation seems to be a lot more interested in the Phoenix-Mesa-Scottsdale and Chicago-Naperville-Elgin metros: a little over 10% of the newcomers to both metros are under 25.
Interestingly enough, metro Chicago is also enticing for a comparatively high proportion of people aged 75 years and over – almost 6%. The only other metro that hovers around 5% for movers belonging to this age bracket is Miami-Fort Lauderdale-West Palm Beach.
Both Millennials and Gen Xers are flocking to the New York City-Newark-Jersey City metro area: about 38% of the newcomers to the area are Millennials, while about 37% represent Gen Xers. The country’s administrative and political center, the Washington-Arlington-Alexandria metro, on the other hand, benefits from a very substantial influx of Gen Xers – a little over 41% of the Americans moving to the capital belong to this generation, while only about 32% of them are Millennials.
Texan metros seem to be attracting a diverse cohort of Americans, age-wise. The Houston metro is pretty popular among the youngest of the movers – almost 10% of the newcomers to the area are 25 and under. The same metro is also particularly appealing for Gen Xers – more than 40% of the people moving there are between 35 and 54 years of age. The Dallas metro inspires the same moving patterns: about 9% of the new arrivals are Gen Z, more than 43% are Gen Xers, while almost 30% are Millennials.
Reasons for Moving: People Move Primarily for Housing, not for Jobs
When it comes to reasons for the move, the results are rather surprising. Metro-to-metro movers are motivated primarily by the desire for a larger or a better-quality home, according to respondents of the American Housing Survey. Almost 17% of the people moving between two of the Top 10 metros for inbound migration are doing so in search of a new home that’s bigger or better than the previous one.
The second reason for moving also relates to quality of living: more than 15% of the people relocating to a different metro area wanted a more desirable neighborhood. Another almost 15% are moving in order to form their own household. Only about 8% of the people moving metro-to-metro are motivated by a new job.
Washington-Arlington-Alexandria holds first place for movers on the hunt for a larger or better-quality home – more than 19%. In a surprising twist, the second-most popular metro for movers looking for larger or better-quality homes is New York-Newark-Jersey City: a little over 18% of the people moving into the area are motivated by this very reason.
Other metro areas where people move primarily in order to get access to better housing are Dallas-Fort Worth-Arlington, with 17.5%, San Francisco-Oakland-Hayward, with 17.1%, and Phoenix-Mesa-Scottsdale, with 16.6%.
When it comes to newcomers in search of desirable neighborhoods, the Atlanta-Sandy Springs-Roswell metro leads the way – about 17% of all those moving to the area. The second metro area that’s well sought-after in terms of nice neighborhoods is Miami-Fort Lauderdale-West Palm Beach, with 16.7% of people moving metro-to-metro aiming for a more desirable neighborhood than the one they left behind.
Almost 11% of the People Moving to San Francisco Do It for a New Job
The San Francisco-Oakland-Hayward metro claims the highest proportion of people coming in for a new job or a job transfer – almost 11% out of all the movers to the area. However, for the rest of the metro areas in the top 10, access to a job is a primary moving reason for under 10% of newcomers. The only metro area where close to 10% of the new arrivals are coming or a new job or a job transfer is Washington-Arlington-Alexandria.
The Chicago-Naperville-Elgin metro has the highest proportion of newcomers driven by economic hardship – almost 4%. Other metros which people in this situation choose to move to are San Francisco-Oakland-Hayward and Miami-Fort Lauderdale-West Palm Beach, with 3.34% and 3.27% of newcomers indicating economic hardship as the primary reason for moving.
Texans Are the Most Family-Oriented
Being close to family is the reason why almost 10% of all the people on the move choose a specific metro area. Houston-The Woodlands-Sugar Land seems to be the most family-oriented metro area, with more than 12% of the newcomers moving (or should we say returning?) to the area in order to be closer to family. Washington-Arlington-Alexandria, on the other hand, doesn’t attract a lot of family reunions – only about 7% of the new arrivals are motivated by being closer to family.
Reducing commuting time is also an incentive for Americans on the move. More than 8% of the people coming to the Houston-The Woodlands-Sugar Land metro area are hoping for a shorter commute. At the other end of the spectrum, only 5.8% of the newcomers to the Miami metro area are hoping for reduced commuting time.
Housing and Self-Storage Impacted by Migration Trends
Alongside inbound migration and population change, domestic net migration – the difference between the people moving in and those moving out – is another important factor to monitor. The New York and Chicago metro areas have no issues in attracting newcomers – it’s the more seasoned residents who need convincing to stay put. Both metros have negative domestic net migration: 63,000 in the case of New York and 57,000 in the case of Chicago. The Los Angeles metro area also has a negative domestic net migration of more than 16,000 people.
The remaining metros analyzed have positive domestic net migration, with the Houston metro area taking the top spot – almost 100,000 more people moved in than out in one year. Dallas follows closely, with a positive net migration of almost 80,000. The Phoenix and Miami metro areas are also net migration winners, with, respectively, 75,000 and 65,000 more newcomers than leavers in one year. The Washington, Atlanta and San Francisco metro areas all have a positive net migration of around 40,000 people in one year.
We looked into the Yardi Matrix data to see how each of the metros in our list fares in terms of new construction – of both self-storage and apartments – and to determine how the local markets are adjusting to the migration trends highlighted above.
Apartments and self-storage construction are on a positive trend in New York City, even though the metropolis is actually losing population. Metro Chicago, another urban area confronted with population loss, has a real estate industry more attuned to the migration trends – construction of apartments and self-storage is slowing down.
The San Francisco metro area is registering population growth and grapples with high housing and self-storage costs, but construction of new apartments is on a slightly descending trend. However, self-storage construction is literally booming, which is great news for the metro’s residents. San Francisco is the country’s most expensive market in terms of self-storage rent, with street rates at $192 per month for a standard 10×10 unit.
San Francisco Metro Sees Steep Increase in Self-Storage Construction
Self-storage is intricately associated with moving – people use self-storage during the moving process and a high influx of people to an area should translate into a flurry of new self-storage developments.
Whether moving to the New York-Newark-Jersey City metro area or moving within its boundaries, people still need self-storage and, apparently, the local sector is delivering. There are 49 under-construction self-storage facilities in the New York metro area in January 2020, which will add almost 3.65 million square feet of rentable space to the total inventory. In terms of square footage, it’s the most of all the metros analyzed and an 82% increase from January 2019.
The Miami-Fort Lauderdale-West Palm Beach metro area is adding an appreciable amount of new self-storage space, but the activity is also slowing down. There are 22 under-construction facilities, representing 1.9 million square feet of rentable space under construction in the area in January 2020, a 9% decrease from January 2019.
Other metros have fewer planned and under-construction facilities – for example San-Francisco-Oakland-Hayward with only 5, representing 0.38 million square feet of rentable space. However, this represents a whopping 200% increase compared to January 2019, which means that self-storage construction is on a steep upward trend there.
The Chicago-Naperville-Elgin metro area has 11 under construction storage facilities totaling 0.73 million square feet of rentable space, representing a negative growth of 5% from January 2019, which is actually in line with the population loss the city is experiencing. The Washington DC metro area, on the other hand, has more than one million sq. ft. of self-storage space under construction at the moment, 35% more than in January 2019.
Another metro that saw a significant increase in under-construction self-storage facilities is Los Angeles-Long Beach-Anaheim. There are 8 under-construction properties comprising 0.77 million square feet of space this January, which signifies a 44% increase compared to January 2019.
An important decrease in self-storage construction was registered in the Houston-The Woodlands-Sugar Land metro area. There are 16 under-construction facilities in the area at the moment, totaling 0.91 million square feet of rentable space, 26% less than in January 2019.
Metro Washington Leads in Under-Construction Apartments
The Washington DC metro area is on a pretty good streak, gaining in terms of net migration and also expanding its multifamily and self-storage sectors. The capital has almost 24,200 apartments under construction right now, a 15% increase from January 2019.
The New York-Newark-Jersey City metro area, despite being confronted with population loss, more than doubles Metro Washington’s number, counting 55,000 under-construction apartments this January, 8% more than in the same month of the previous year.
The Californian metros San Francisco-Oakland-Hayward and Los Angeles-Long Beach-Anaheim have a much lower volume of under construction new apartments at the moment: about 18,000 and 26,000 respectively, which represents a 3% decrease for both from January 2019.
The pace of construction in Texas is also slowing down – the Dallas-Fort Worth-Arlington metro area has 43,500 apartments under construction in January 2020, 13% less than during the same month of the previous year. The other Texan metro in the top 10, Houston-The Woodlands-Sugar Land, has a smaller volume of under construction apartments – almost 18,300.
Regardless of where you are planning to move to, your reasons for moving or the generation you belong to, one thing is certain: you are going to need self-storage, and the best place to find conveniently located self-storage units is on StorageCafe.
Methodology
This research was conducted by StorageCafe, an online listings portal where people can easily find self-storage units for rent across the United States.
Since the self-storage industry is closely related to migration patterns, we ranked the 389 U.S. metros based on inbound migration and also examined actual population changes. We then studied migration trends to put together a profile of today’s American on the move, and identified the real estate market evolution in the country’s top 10 metro areas for inbound migration.
Migration data was taken from the US Census, while the multifamily and self-storage new construction data was taken from Yardi Matrix, a leading commercial real estate research and data platform and our sister division.
Fair Use and Distribution:
This study serves as a resource for the general public on issues of common interest and should not be regarded as investment advice. The data is true to the best of our knowledge but may change if amendments to it are made. We agree to the distribution of this content, but we do require a mention in return for attribution purposes.


Under-Bed Storage Ideas: From Options to Precautions
The space under your bed is some of the most valuable (and most overlooked) square footage in your home. For anyone needing more storage in a small apartment, tiny home, a student dorm or just a space shared with roommates, that low, hidden zone can absorb off-season clothes, spare bedding and luggage without cluttering a single visible surface. But under-bed storage rewards a little strategy. Used well, it clears your floors and frees your closets. Used carelessly, it can trap moisture against your mattress and, in time, damage the very things you were trying to protect. Here are some under-bed storage ideas to help you get the upside without the downside.

RV Storage Ideas: Smart Solutions for Every Space
The best RV storage ideas work by finding space you already have but aren’t using — under beds, inside cabinet doors, on walls, above entry steps and in the overhead bunk. Most RV owners run out of obvious places quickly, but the real storage capacity in a typical trailer or motorhome comes from vertical surfaces, divided compartments and rethinking what each space was designed for.

Kitchen Cabinet Organization Ideas for Less Chaos
The best way to organize kitchen cabinets is to store items where you actually use them: mugs near the coffee maker, plates close to the dishwasher, spices next to the stove. Small placement decisions like these turn crowded cabinets into functional ones, and they cost nothing to implement.

Where to Donate Clothes in NYC: From Pickup to Mutual Aid
Every year, 200,000 tons of clothing end up in NYC landfills — but yours doesn’t have to. Your unwanted clothes have a real second life waiting. Whether it’s a low-income family needing affordable basics, a woman reentering the workforce looking for interview wear, or an undocumented resident accessing free community support, the donation method you choose matters. Plus, there are plenty of convenient ways to go about it. Local mutual aid groups, free pickup services, mail-in programs, workforce nonprofits, and textile recycling — each one routes your clothes to neighbors and causes that need them most. Here’s where to donate clothes in NYC, according to your plans.

The Best U.S. Metros To Own A Boat
Boating is one of America’s favorite pastimes. According to the National Marine Manufacturers Association, nearly 100 million Americans go boating each year, and recreational boating contributes over $230 billion annually to the U.S. economy. It’s a lifestyle deeply shaped by geography, climate, and local culture.

Packing Tips for Moving in a Hurry: 5 Ways to Speed Things Up
Sometimes a move sneaks up on you and you wind up having to move in a hurry. A job starts sooner than expected, a lease ends abruptly, a sale closes fast, or life simply throws a curveball and suddenly you’re staring at a full house with only days or weeks to empty it. That short timeline can feel overwhelming, but it doesn’t have to mean chaos. With a focused plan and a few smart shortcuts, you can pack up quickly, protect your belongings, and land in your new home without losing your mind.

How to Store Tools Properly: Keep Equipment Rust-Free and Tidy
Good tool storage saves you time, money and the very specific rage of finding a rusted drill you paid good money for. Cleaning, drying and organizing your tools properly keeps them rust-free and findable — and it takes less effort than most people assume. True, nobody wakes up thrilled to organize their tools; it ranks somewhere between cleaning the gutters and reading the terms of service. But here’s how to do it right without the hassle.

Drive-Up Storage Units: Pros, Cons and When They’re Worth It
A drive-up storage unit is a ground-level space with an exterior roll-up door, a lot like a detached garage. Units are usually arranged in rows with wide, paved aisles between them, so you can pull a car, van, or moving truck directly up to your door during access hours. The key feature is the access, and it comes in a few forms:

2026’s Best Cities for Roommates: Irvine, CA, and Atlanta, GA, Lead in Shared Living Gains
Americans sharing a two-bedroom apartment instead of renting a one-bedroom alone can save, on average, about $6,700 per year. In some of the country’s most expensive cities, including Irvine, California, or Jersey City, New Jersey, the savings gap widens to around $13,000. For a growing share of renters, living with roommates is less of a lifestyle arrangement and more a conscious financial strategy.