

Key Points:
- Street rates are down across the US, with Minneapolis–St. Paul–Bloomington experiencing the most dramatic drop among the 10 most active markets, down 11.2% y-o-y.
- New York–Newark–Jersey City tops the charts with the most rentable square footage of new self storage construction completed in 2019 – 3 million sq. ft.
- The market with the largest inventory at a national level is Dallas–Fort Worth–Arlington, with over 62 million square feet of total self storage inventory.
The considerable new self storage supply has been sending rents plummeting for much of last year. But the market was still booming at the beginning of 2020. Demand was strong and net move-in rates were positive in most US markets.
Come March, things had started to shake a little as COVID-19 caused entire business sectors to come to a halt, forcing many companies to seek solutions in order to move forward and even ways to reinvent themselves. Digitalization was a good find for many industries and self storage is somehow privileged in that sense. Many self storage owners and operators had already implemented or discussed development of tech tools that allowed them to go on as usual, even with social distancing recommendations in place. Virtual tours, online booking and payment, self-service kiosks, and valet service have all contributed to streamlining operations across the board. Moreover, self storage owners have offered move-in specials and concessions, including student discounts and late fee waivers to keep occupancy rates high.
In fact, the self storage property development market is still active, with developers encouraged by the country’s demand profile and positive net move-ins in both May and June. Self storage has always done a great job responding to people’s needs both during times of economic prosperity when it’s natural to have surplus items and extra storage becomes a must, as well as in times of distress when many turn to self storage while downsizing or dealing with unplanned moves.
“Self storage demand seems to be holding up well amid the current pandemic and resulting economic slowdown,” says Chris Nebenzahl, Institutional Research Manager at Yardi Matrix, a national real estate research firm and StorageCafe’s sister division.
“While street rates have fallen quickly and dramatically, many operators are reporting strong collections and decent rental activity. Demand is emerging from new sources, including college students that were forced to quickly relocate, as well as businesses like restaurants and retail that have been forced to redesign the interior of their locations. So far, we have not seen much housing displacement which has led to storage demand in the past, but that may increase as the year goes on.”
Self Storage Turns into a Renter’s Market: High Supply and Decreasing Rents
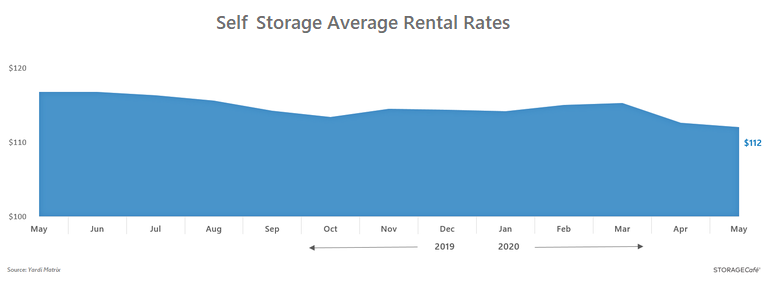
While COVID-19 has had an impact on demand, and many markets were faced with uncertainty and a certain decrease in consumer interest when the pandemic debuted, much of the rent decreases can be attributed to swelling inventories. Street rates had already been on a descending slope in many markets when the coronavirus hit, with rents only declining at a faster rate in the subsequent months.
If there’s a time when renting a self storage unit is better, then it may well be now when prices are down and options abound. The national average street rate for a standard 10×10 non-climate controlled unit was $112 in May 2020, down 4.3% year-over-year, as reported by Yardi Matrix.
US Self Storage Inventory Exceeds 1.4Bn. Square Feet
The U.S. currently has over 1.4 billion square feet of self storage inventory, out of which 190 million square feet – or 13% – was built over the span of the last 5 years. The best year in terms of new deliveries was undoubtedly 2018, when no less than 55.2 million square feet of rentable self storage came online, 48.3% more than in 2017.
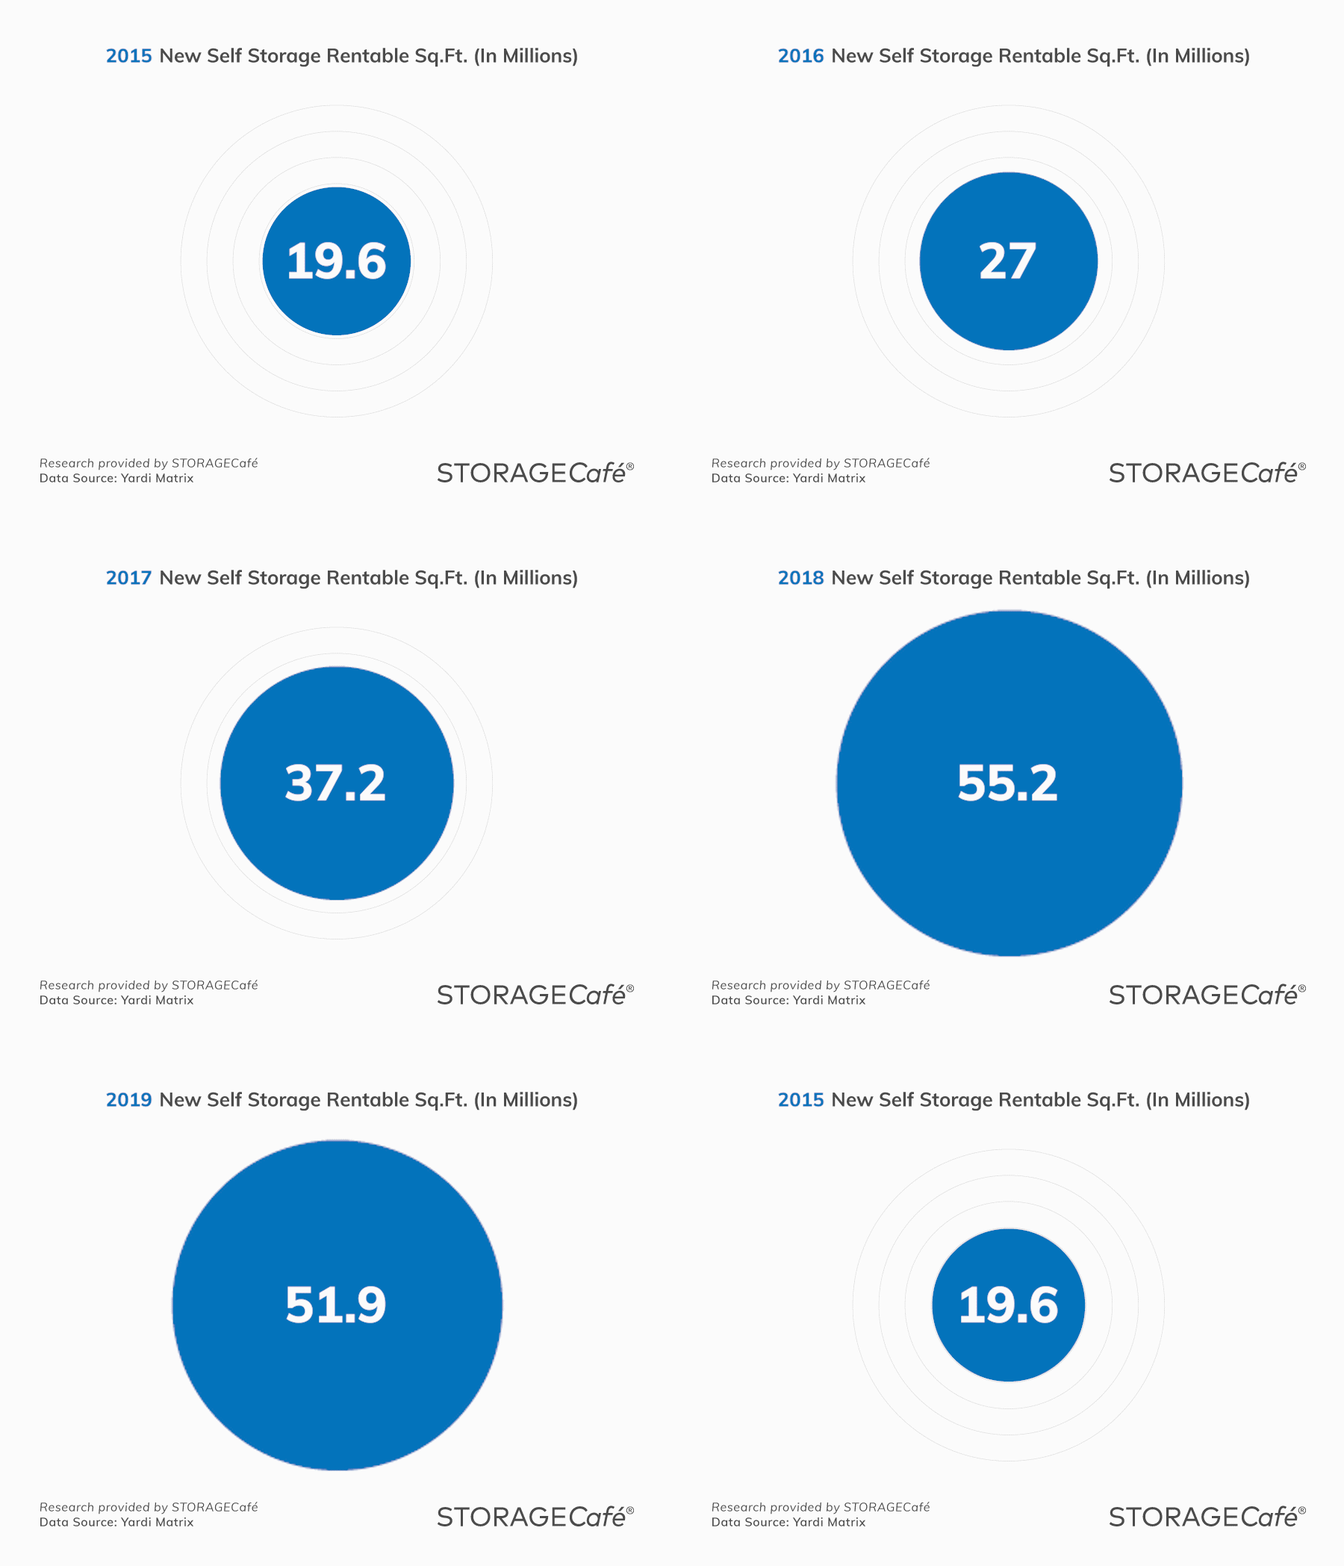
2019 was another strong year for self storage completions with a significant 51.9 million rentable square feet finalized, an area that would comprise the whole of Central Park and six times the Grand Central Terminal. Interestingly enough, about 27% of new deliveries in 2019 were concentrated in 10 major markets.
[TABS_R id=1559]
To identify the largest development markets in terms of new self storage completions in 2019, we at StorageCafe looked at Yardi Matrix self storage data and analyzed self storage construction in all major cities across the U.S. The biggest winner in 2019 in terms of new storage space is New York–Newark–Jersey City, with a whopping 3 million square feet entering the market. This seems only fair since, of the U.S.’s 10 biggest self storage markets, it is the most undersupplied, with existing inventory at 3.1 square feet per capita. It is also one of the priciest in the U.S.
Let’s have a closer look at the self storage landscape in the 10 metro areas that welcomed the most new self storage supply in 2019.
1. New York–Newark–Jersey City, NY–NJ–PA

After three years of consistent but tame construction levels when completions hovered around 1 million square feet on a yearly basis, 2018 saw a considerable boost, as new deliveries topped 2 million square feet.
In 2019, New York–Newark–Jersey City witnessed a record 3 million square feet of self storage completions, the largest amount of square footage of new constructions in the U.S. – which is more than twice the size of Yankee Stadium. This historically high number of new developments in NY–NJ–PA boosts the market from #5 in the previous year’s top 10 straight to #1 in 2019.
While being the most active in terms of square footage additions, New York–Newark–Jersey City is the market with the least self storage per capita, namely 3.1 square feet and a total rentable inventory of over 59.7 million square feet.
It may come as no surprise then that New York–Newark–Jersey City is the third priciest self storage market in the U.S. On a more positive note for NY renters, street rates have seen a deceleration in recent months as new supply comes online. The average rent in May 2020 was $165, down 4.6% from 2019.
As for 2020, there are approximately 65 new self storage constructions expected to be completed, which will make up about 5.8 million square feet of self storage space. Another 138 new facilities are in the pipeline, expected to be finalized in 2021 and 2022.
2. Phoenix–Mesa–Scottsdale, AZ
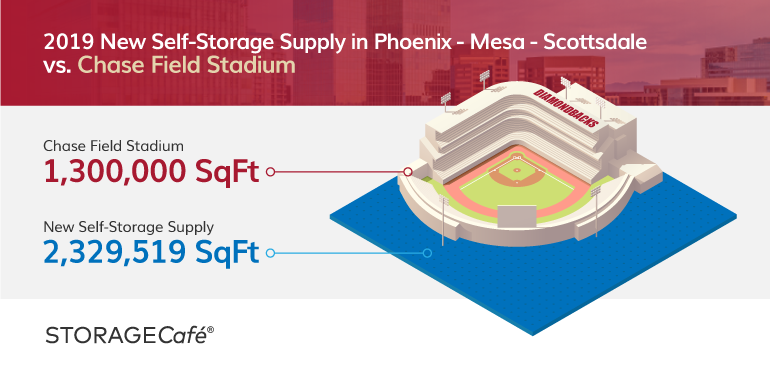
Arizona takes the second place on the podium, with Phoenix–Mesa–Scottsdale being the next most active market in terms of new self storage completions, adding over 2.3 million square feet of new construction in 2019 – almost twice the size of Chase Field. The market shows a spectacular increase in new developments, doubling its deliveries from 2018, when there were a little over 1.1 million square feet of self storage built, slightly less than in 2017 when self storage construction almost reached 1.3 million in square footage.
The most significant Y-o-Y boost occurred in 2017-2018, while the previous two years showed just a little over half a million square feet of new self storage completions in this market. This huge number of completions hit street rate evolution hard at that time and slowed down growth trends across the board.
In May 2020, street rates for Phoenix self storage units remained virtually unchanged from 2019 – $103 on average.
In terms of square feet per capita, Phoenix–Mesa–Scottsdale has 7.5 square feet of self storage, considerably more than the first market in our top 10, with a total rentable inventory of over 31.5 million square feet.
The market expects approximately 23 new facilities to be completed this year, totaling approx. 1.7 million square feet. 49 more facilities are planned to be delivered in the upcoming two years.
3. Dallas–Fort Worth–Arlington, TX
Texas dominated the self storage industry in the past couple of years, but it stepped back with its constructions in 2019, showing a slowdown in deliveries, most probably confronted with a drop in street rates.
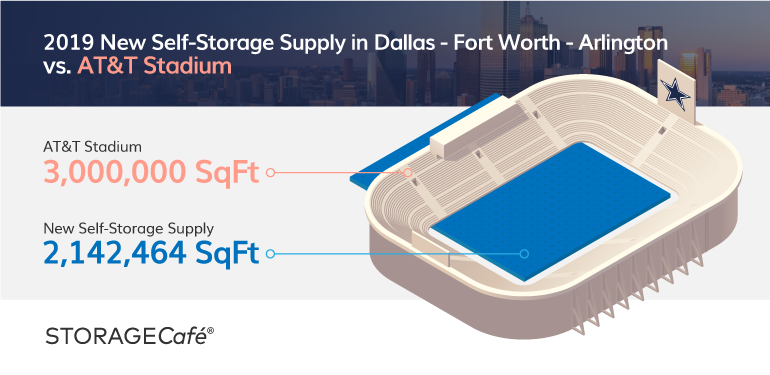
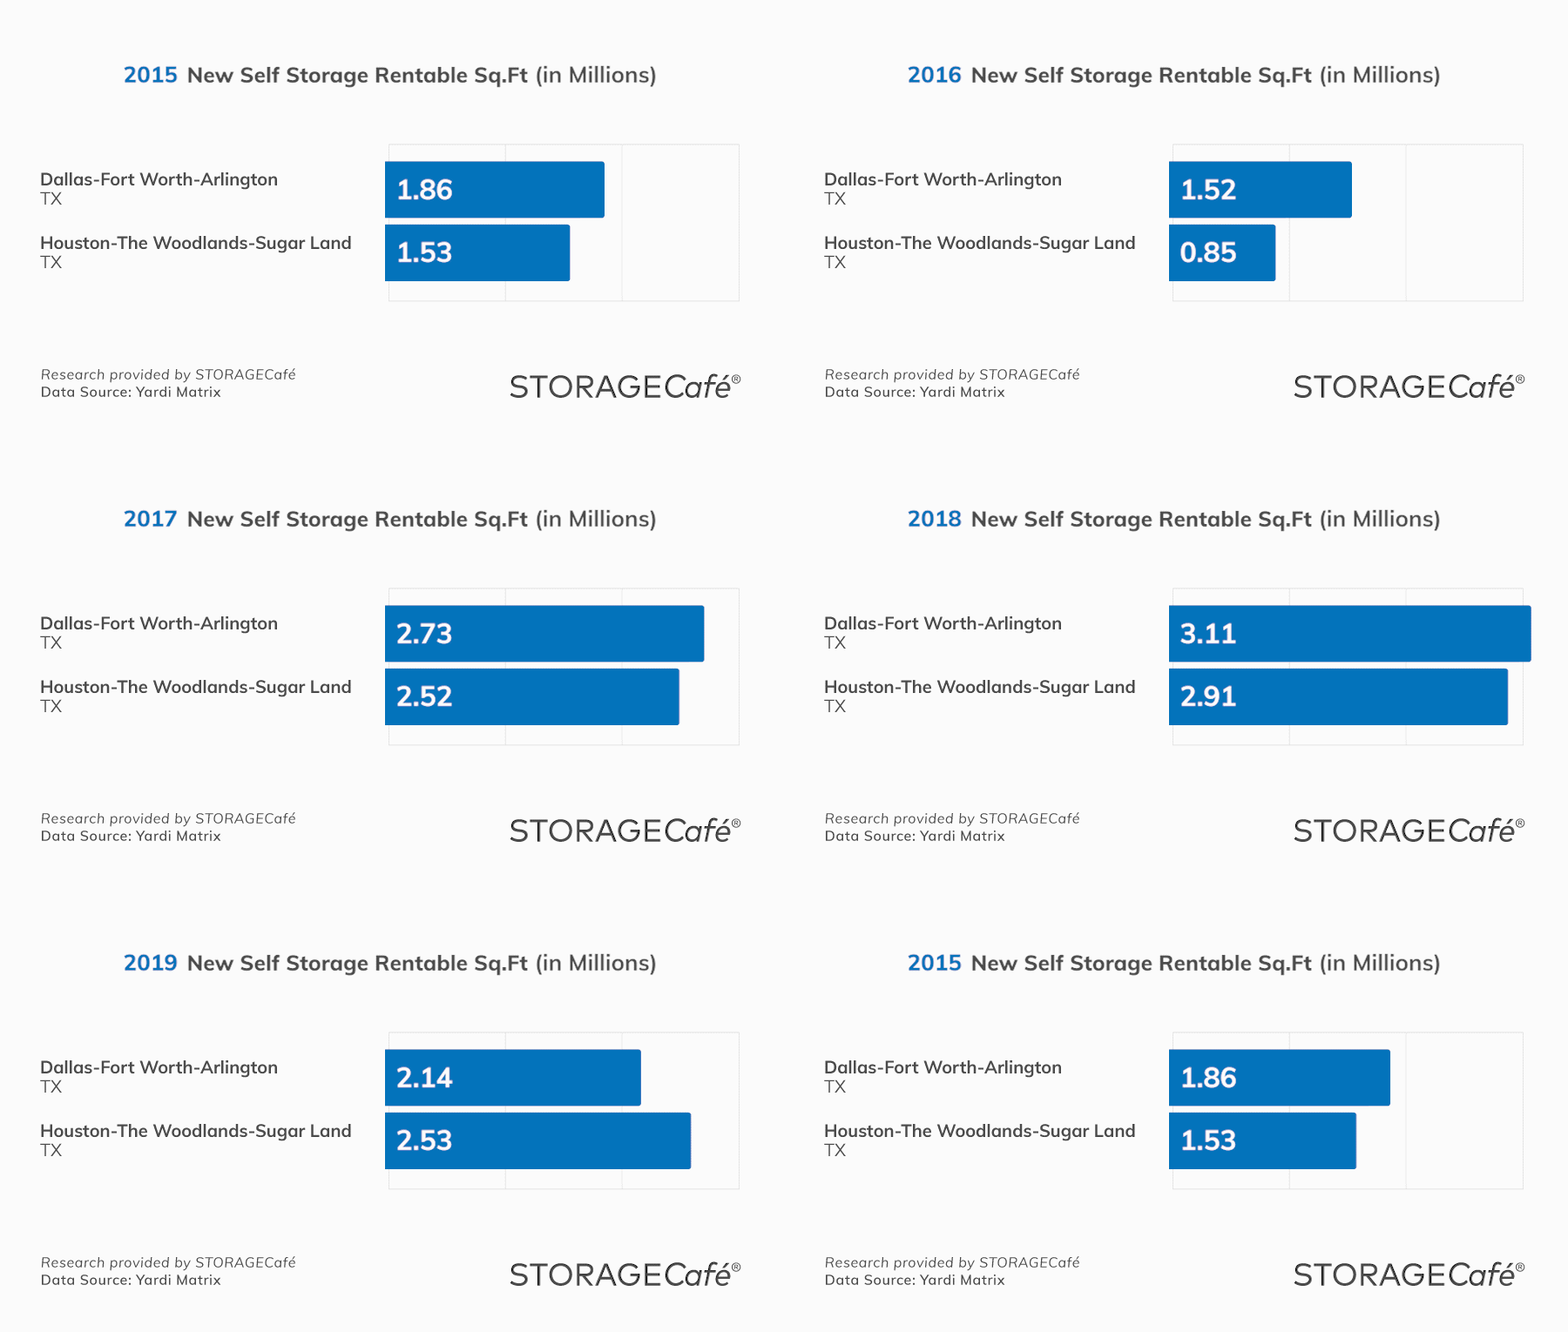
In 2019, for the first time, Dallas–Fort Worth–Arlington takes third place in the top 10 most active markets in terms of self storage construction. The market had over 2 million square feet of new self storage construction in 2019, which is more than two thirds of the huge AT&T Stadium. After being #1 in 2015, 2017 and 2018, it was #2 in 2016, when it was outpaced by Chicago–Naperville–Elgin with half a million more square feet of new completions.
In contrast to the New York–Newark–Jersey City metro area, this market shows a decrease of 1 million square feet in new deliveries in a Y-o-Y comparison with 2018, when it was at its peak. 2018 brought 3.1 million square feet of self storage construction to the Texan market, the most that was ever built in one year in any U.S. state.
The 2015 completed rentable square footage exceeded 1.8 million, which is also a shockingly high number for that year. 2016 showed a slight decrease, but still no less than 1.5 million square feet of new deliveries.
The abundance of new self storage construction leads to a high number of square feet per capita, precisely 9.8 – which almost equals one whole standard 10×10 storage unit for every 10 citizens. The total inventory in Dallas–Fort Worth–Arlington is over 62.7 million square feet of self storage space – the largest inventory level in the U.S.
The average price for a storage unit has lowered over the years – from $112 in 2016 it fell to $91 in May 2020. This sets Dallas among the cheapest self storage markets in the country. In fact, 8 markets in Texas have rates below the national average of $112, including Houston, Austin, San Antonio and El Paso.
As a forecast for the following years, available data suggests that 17 more facilities – or over 1.4 million square feet – are due to be completed in 2020, with another 34 in the pipeline.
4. Atlanta–Sandy Springs–Roswell, GA
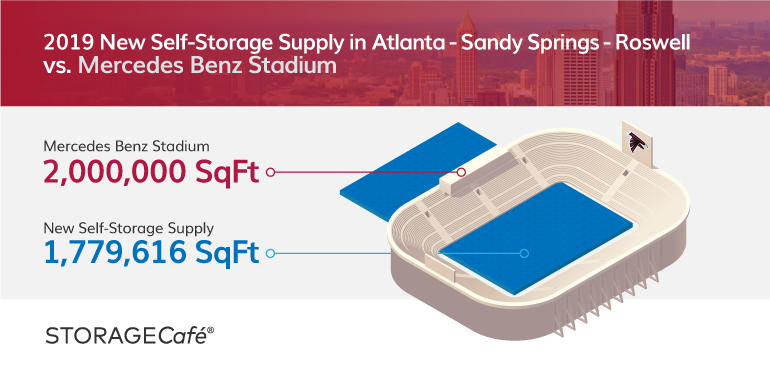
The Georgian market occupies the fourth position in our top 10 most active self storage markets, with over 1.7 million completed rentable square feet delivered in 2019 – almost the size of the Mercedes Benz Stadium. Following the construction of over 1.8 million square feet in 2018, last year the market showed a slight decrease. The market was at its highest point in 2018, having seen a substantial boost compared to the previous year, more than doubling its new self storage deliveries.
The average rent for a standard self storage unit in Atlanta–Sandy Springs–Roswell was $92 in May 2020, a decrease of 8% from the previous year when it was at its priciest in the past 5 years.
When it comes to square footage per capita, Atlanta–Sandy Springs–Roswell has 7.1 square feet per person, with a total inventory of more than 37 million square feet of self storage space.
In 2020, 22 more facilities are expected to be completed, which will take up more than 1.5 million square feet. In 2021 and 2022, 36 other storage buildings are planned to be delivered.
5. Minneapolis–St. Paul–Bloomington, MN–WI
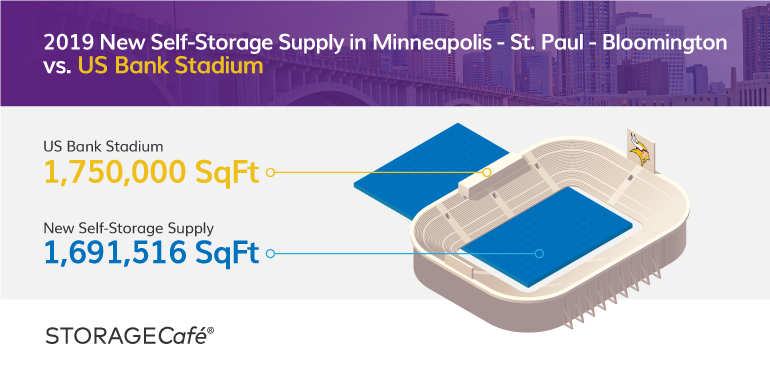
Minneapolis–St. Paul–Bloomington is the fifth-most active market in terms of self storage completions in 2019, seeing almost 1.7 million square feet delivered last year, which is almost the size of the U.S. Bank Stadium. Unlike the Georgian market just described, it has shown a considerable increase when compared to the number of new self storage deliveries in 2018, a year in which less than 1 million square feet were completed. Taking a look at the year before, the difference in new construction is even greater – in 2017 there were only about 350.000 rentable square feet of new self storage facilities. The market was at its peak in 2019, presenting significant evolution over the past five years.
In terms of pricing, Minneapolis–St. Paul–Bloomington has seen the biggest decrease among the 10 most active self storage markets, with rents down 11.2% year-over-year.
The square footage per capita in this market is 5.1, which is roughly equal to half a standard unit for every 10 people. The market has a total inventory of more than 1.6 million square feet of self storage construction, and in 2020 over 1.3 million more are expected to be delivered, in another 15 storage facilities. 33 more facilities are due to be finalized in the next two years.
6. Orlando–Kissimmee–Sanford, FL
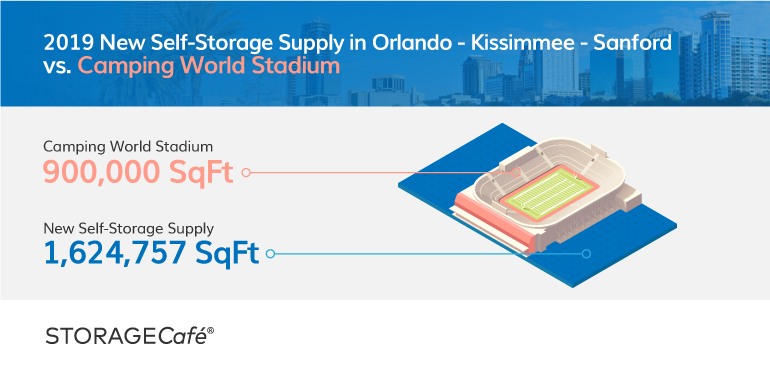
Florida’s most active market is Orlando–Kissimmee–Sanford, with over 1.6 million square feet of new developments in 2019, almost twice the size of the Camping World Stadium. For the first time in the past five years, this market reached the top 10, by doubling the number of constructions built in 2018. The previous three years showed less substantial but constant growth, going from a little over 100,000 square feet of new self storage construction in 2015, to over 400,000 in 2016 and around 600,000 in 2017.
The average rent for a standard self storage unit in Orlando–Kissimmee–Sanford is $96, as seen in May 2020, down 7.7% from 2019.
Even with a significant population change of 7.8% from 2015 to 2018, the square footage of self storage per capita in this market is still one of the highest, namely 8.3, being outpaced only by Texas. The total inventory of rentable square footage of self storage construction in Orlando–Kissimmee–Sanford exceeds 17 million and forecast data for 2020 show that over 1.5 million more – or 19 new facilities – will be added. In 2021 and 2022 another 22 facilities are expected to be completed.
7. Miami–Fort Lauderdale–West Palm Beach, FL

Hand in hand with Orlando goes Miami–Fort Lauderdale–West Palm Beach, with almost 1.6 million square feet of new development in the self storage sector last year, which is more than the size of the whole Hard Rock Stadium. However, 2019 showed a slowdown in deliveries compared to 2018, and the market had over 2 million square feet of self storage construction, the highest delivery level in the last 5 years.
Even though local rents went down 7.5% y-o-y, Miami still ranks among the top 20 most expensive markets in the US. Street rates sat $124 in May 2020.
In terms of square footage per capita, Miami–Fort Lauderdale–West Palm Beach has 6.6 square feet of rentable self storage, with a total inventory of 36.5 million square feet. This year, 32 new facilities – or 2.5M square feet of self storage space – are expected to be completed, while 48 others are in the pipeline for 2021 and 2022.
8. Chicago–Naperville–Elgin, IL–IN–WI

Chicago–Naperville–Elgin is another dense market when it comes to self storage construction, with over 1.5 million square feet of new developments in 2019, which is almost 4 times the size of Soldier Field. Last year the market showed an increase in new deliveries, after two years of slowdown. In 2016, the market reached its highest point in terms of self storage construction, with over 2 million new rentable square feet on the market, almost triple the amount that was built in 2015, which was 700,000 square feet.
In May 2020, Chicago saw a decrease of 5% from 2019, with average rents now set at $96.
The square footage of self storage per capita is 4.9 in Chicago–Naperville–Elgin, with a total inventory of over 46 million rentable square feet.
Yardi Matrix data shows that 18 new storage facilities are set to be completed in 2020, encompassing over 1.1 million square feet. Another 14 storage facilities are planned for 2021 and 2022.
9. Houston–The Woodlands–Sugar Land, TX
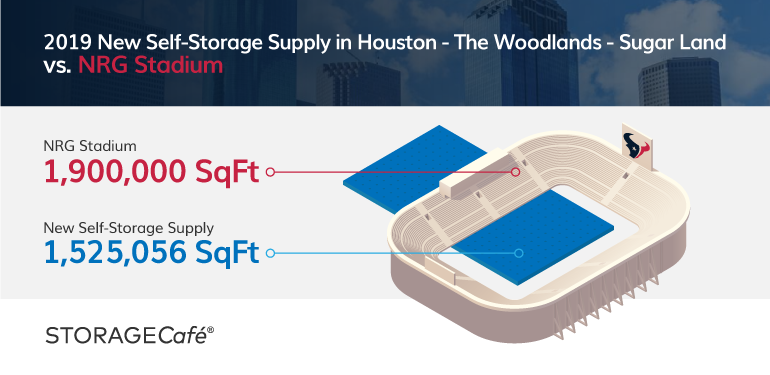
The second Texan market with a considerable amount of new self storage construction is Houston–The Woodlands–Sugar Land, which delivered over 1.5 million square feet in 2019 – almost the size of the NRG Stadium. But, just like Dallas–Fort Worth–Arlington, it shows a noticeable slowdown in deliveries compared to the previous year. In 2018, the market delivered over 2.9 million square feet of self storage construction, which is almost double the amount that was built last year. Prior to this peak, the market had another prosperous year, with over 2.5 million square feet built in 2017, triple the total of the previous year, when around 800,000 square feet were delivered. In 2015 the number of new self storage arrivals on the market was very similar to 2019, with a little over 1.5 million rentable square feet completed.
In terms of rent prices, in May 2020 the average street rate for a standard unit was $81, the Houston self storage market showing a consistent decrease from the previous years. Rents went down 5.8% y-o-y and an impressive 23.6% from 2016, the steepest 5-year decline among the top 10 markets.
This Texan market has the highest volume of self storage construction per capita in square footage, precisely 10.5, which is more than one standard 10×10 storage unit for every 10 citizens. Houston–The Woodlands–Sugar Land also has the largest amount of self storage construction as seen as a proportion of total inventory in January 2020, exceeding 62 million square feet for a total population of almost 6 million people.
2020 expects another 18 facilities – or approximately 1.2 million square feet of new self storage construction – to be delivered, with 35 more in the pipeline.
10. Portland–Vancouver–Hillsboro, OR–WA
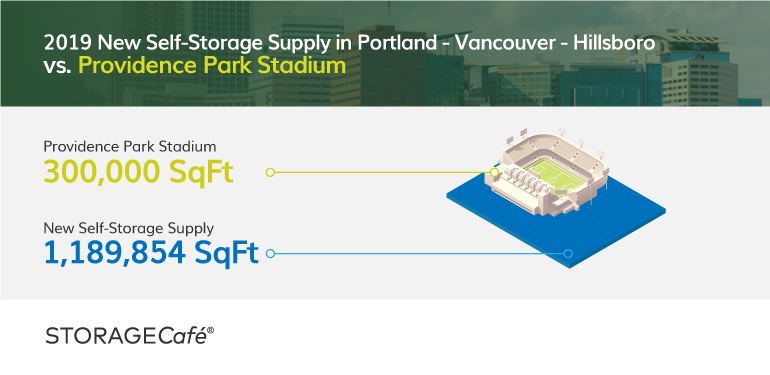
Portland–Vancouver–Hillsboro occupies the 10th position in our list of the top 10 most active markets in terms of self storage construction, with over 1.1 million square feet of new developments arriving in 2019, which is four times the Providence Park Stadium. The market shows consistent growth over the past five years, with the number of new facilities under construction doubling in both 2018 and 2019 as compared to the previous years. Very similar to Orlando–Kissimmee–Sanford’s evolution, the market started with a little over 100,000 square feet of new self storage additions in 2015 and exceeded 1 million by the end of 2019.
The price for a standard unit was $135 in May 2020, showing a year-over-year drop of 4.9%. Portland, however, remains one of the most expensive self storage markets in the US, the 10th priciest among the 100 most active development markets.
As per January 2020 data, Portland–Vancouver–Hillsboro has a grand total of 13.8 million rentable square feet of self storage space, with 6.2 square feet per capita.
The market expects over 900,000 square feet of new self storage deliveries to arrive in 2020, or approximately 11 new facilities, with 23 more in the pipeline.
Care to see what the state of the self storage market is in the biggest U.S. metros? Check out the full list of the 100 most active markets for new self storage construction in 2019:
Top 100 Most Active Markets for New Self Storage Construction in 2019
Data Source: Yardi Matrix, US Census
# Metro Name New Self Storage Supply in 2019 (sq.ft.) Y-o-Y Change in New Self Storage Supply Avg. Metro Rate 10’x10’ (non cc) Y-o-Y Change in Avg. Rent Net Migration 2017-2018
1 New York-Newark-Jersey City, NY-NJ-PA 3,009,299 43.80% $165 -4.60% -101,262
2 Phoenix-Mesa-Scottsdale, AZ 2,329,519 101.80% $103 -1.90% 72,939
3 Dallas-Fort Worth-Arlington, TX 2,142,464 -31.20% $91 -5.20% 77,531
4 Atlanta-Sandy Springs-Roswell, GA 1,779,616 -3.40% $92 -8.00% 43,362
5 Minneapolis-St. Paul-Bloomington, MN-WI 1,691,516 71.20% $103 -11.20% 15,575
6 Orlando-Kissimmee-Sanford, FL 1,624,757 105.70% $96 -7.70% 49,861
7 Miami-Fort Lauderdale-West Palm Beach, FL 1,585,534 -31.10% $124 -7.50% 34,335
8 Chicago-Naperville-Elgin, IL-IN-WI 1,550,643 24.80% $96 -5.00% -58,691
9 Houston-The Woodlands-Sugar Land, TX 1,525,056 -47.60% $81 -5.80% 35,397
10 Portland-Vancouver-Hillsboro, OR-WA 1,189,854 71.00% $135 -4.90% 13,097
11 Seattle-Tacoma-Bellevue, WA 1,182,430 55.50% $153 -5.00% 33,621
12 Boston-Cambridge-Newton, MA-NH 1,115,240 2.60% $140 -5.40% 18,329
13 Washington-Arlington-Alexandria, DC-VA-MD-WV 1,097,053 -9.80% $135 -8.20% 9,040
14 Los Angeles-Long Beach-Anaheim, CA 1,087,767 60.30% $179 -7.70% -73,532
15 Austin-Round Rock, TX 1,066,588 8.80% $94 -4.10% 37,212
16 Denver-Aurora-Lakewood, CO 1,040,457 -52.00% $114 -5.80% 22,981
17 Tampa-St. Petersburg-Clearwater, FL 849,494 -57.60% $102 -6.40% 52,204
18 Nashville-Davidson-Murfreesboro-Franklin, TN 849,069 -17.30% $98 -9.30% 21,317
19 New Orleans-Metairie, LA 697,455 1039.40% $112 5.70% -3,598
20 San Antonio-New Braunfels, TX 639,965 -18.60% $94 -4.10% 28,152
21 St. Louis, MO-IL 630,104 121.50% $89 -4.30% -5,229
22 Baltimore-Columbia-Towson, MD 615,845 -8.50% $121 -7.60% -2,435
23 Cape Coral-Fort Myers, FL 612,288 330.90% $96 -7.70% 16,221
24 Salt Lake City, UT 591,669 26.10% $95 -2.10% 5,994
25 Jacksonville, FL 543,560 -26.00% $94 9.30% 24,990
26 Kansas City, MO-KS 535,275 143.20% $95 -1.00% 7,200
27 San Jose-Sunnyvale-Santa Clara, CA 505,640 314.90% $160 -9.60% -5,870
28 Charleston-North Charleston, SC 491,220 0.20% $86 -10.40% 9,450
29 Pittsburgh, PA 477,297 -15.10% $109 -1.80% -761
30 Milwaukee-Waukesha-West Allis, WI 476,923 -36.70% $85 -6.60% -4,575
31 Birmingham-Hoover, AL 452,710 376.70% $89 -5.30% 517
32 Columbia, SC 449,702 141.50% $81 -8.00% 5,494
33 Detroit-Warren-Dearborn, MI 438,986 35.40% $103 -6.40% -2,266
34 Sacramento-Roseville-Arden-Arcade, CA 432,242 37.70% $129 -4.40% 16,279
35 Charlotte-Concord-Gastonia, NC-SC 428,555 -70.50% $79 -8.10% 33,225
36 Las Vegas-Henderson-Paradise, NV 416,059 24.20% $103 -3.70% 38,386
37 Colorado Springs, CO 387,931 -1.40% $105 -5.40% 8,546
38 Indianapolis-Carmel-Anderson, IN 376,608 -61.10% $81 -4.70% 12,268
39 Greenville-Anderson-Mauldin, SC 372,613 -19.50% $71 -10.10% 9,299
40 Richmond, VA 367,283 -44.00% $94 -1.10% 9,610
41 Ogden-Clearfield, UT 366,574 245.20% $90 -1.10% 3,768
42 Cincinnati, OH-KY-IN 360,394 36.50% $87 -4.40% 4,170
43 Louisville/Jefferson County, KY-IN 359,361 -45.30% $82 -7.90% 1,412
44 Philadelphia-Camden-Wilmington, PA-NJ-DE-MD 357,946 -60.40% $116 -6.50% 7,247
45 Albany-Schenectady-Troy, NY 350,728 161.40% $99 -1.00% 459
46 Greensboro-High Point, NC 344,357 229.60% $79 -4.80% 3,003
47 San Diego-Carlsbad, CA 343,362 -42.20% $153 -2.50% -524
48 Myrtle Beach-Conway-North Myrtle Beach, SC-NC 336,005 194.80% $78 -11.40% 18,618
49 Virginia Beach-Norfolk-Newport News, VA-NC 322,426 28.70% $93 1.10% -2,775
50 Raleigh, NC 319,187 -59.60% $85 -3.40% 20,538
51 Tulsa, OK 316,040 29.50% $71 0.00% -942
52 Durham-Chapel Hill, NC 309,893 -17.20% $85 -3.40% 6,717
53 Riverside-San Bernardino-Ontario, CA 303,868 9.10% $111 -2.60% 23,935
54 Provo-Orem, UT 297,769 -21.70% $88 -15.40% 6,115
55 Spokane-Spokane Valley, WA 292,649 129.70% $96 2.10% 8,180
56 Des Moines-West Des Moines, IA 283,835 -10.20% $85 -7.60% 6,081
57 Boise City, ID 276,214 31.00% $82 1.20% 16,591
58 Fort Collins, CO 273,742 -9.40% $109 -6.00% 5,364
59 Albuquerque, NM 260,754 4.30% $94 -1.10% 1,177
60 Cleveland-Elyria, OH 242,881 -3.40% $92 -3.20% -2,209
61 Grand Rapids-Wyoming, MI 237,505 -6.10% $82 -2.40% 3,580
62 Youngstown-Warren-Boardman, OH-PA 229,147 131.40% $86 -3.40% -1,640
63 Baton Rouge, LA 214,754 24.20% $95 0.00% -3,430
64 Madison, WI 202,634 44.10% $83 0.00% 2,977
65 Lakeland-Winter Haven, FL 197,623 100% $96 9.10% 21,245
66 Toledo, OH 196,688 100% $74 -1.30% -2,193
67 Portland-South Portland, ME 193,695 52.80% $120 -0.80% 3,224
68 North Port-Sarasota-Bradenton, FL 187,678 -31.70% $113 -2.60% 20,180
69 Omaha-Council Bluffs, NE-IA 179,970 -57.30% $79 0.00% 3,643
70 Racine, WI 178,178 204.30% $95 -15.90% 20
71 Hartford-West Hartford-East Hartford, CT 154,182 -50.90% $96 3.20% -1,164
72 Naples-Immokalee-Marco Island, FL 148,224 -59.50% $106 -3.60% 6,711
73 Lexington-Fayette, KY 142,377 1148.90% $85 1.20% 1,700
74 Oklahoma City, OK 139,957 -51.70% $64 -1.50% 6,648
75 Memphis, TN-MS-AR 134,701 15.60% $82 -6.80% -2,428
76 Lubbock, TX 129,483 135.70% $80 25.00% 878
77 Knoxville, TN 128,367 -28.40% $90 -3.20% 7,717
78 Spartanburg, SC 126,960 -29.20% $75 -14.80% 6,657
79 San Luis Obispo-Paso Robles-Arroyo Grande, CA 124,769 97.50% $129 1.60% 1,037
80 Olympia-Tumwater, WA 123,405 -25.40% $141 0.70% 5,190
81 Worcester, MA-CT 119,687 -17.40% $116 -7.90% 4,325
82 Bremerton-Silverdale, WA 118,927 100% $140 -6.00% 2,504
83 Amarillo, TX 118,293 100% $73 -3.90% -203
84 Palm Bay-Melbourne-Titusville, FL 118,129 -20.30% $110 -1.80% 10,703
85 New Haven-Milford, CT 117,335 -57.30% $127 -1.60% -920
86 Providence-Warwick, RI-MA 116,825 -37.20% $120 -14.30% 3,445
87 Bridgeport-Stamford-Norwalk, CT 113,000 -37.70% $113 -7.40% -2,358
88 Yakima, WA 111,195 100% $104 13.00% -743
89 Panama City, FL 105,592 100% $92 3.40% 1,091
90 San Francisco-Oakland-Hayward, CA 103,538 19.40% $186 -4.10% 1,526
91 El Paso, TX 102,589 44.00% $76 7.00% -6,549
92 Bend-Redmond, OR 97,682 21.70% $128 0.80% 4,784
93 Flint, MI 94,278 136.10% $73 1.40% -863
94 Columbus, OH 93,908 -87.50% $84 -4.50% 13,361
95 Santa Fe, NM 90,317 -7.80% $127 -7.30% 365
96 Buffalo-Cheektowaga-Niagara Falls, NY 88,730 -48.20% $104 -5.50% 925
97 Madera, CA 87,392 100% $89 6.00% 474
98 Tuscaloosa, AL 87,236 100% $103 -4.60% 226
99 Brownsville-Harlingen, TX 87,070 -27.50% $84 10.50% -3,058
100 Chattanooga, TN-GA 86,494 -19.00% $74 -9.80% 4,377
Methodology:
- This research was conducted by STORAGECafé, an online listings portal where people can easily find self storage units for rent. STORAGECafé currently features nearly 25,000 self storage facilities – or 300,000 units – all across the U.S.
- Our research team identified the most active markets in terms of new self storage completions in 2019 and analyzed their evolution over the course of the past five years by looking at data provided by Yardi Matrix.
- To come up with the list of the ten most active self storage markets, we analyzed 383 U.S. metropolitan areas in terms of rentable square footage delivered in 2019.
- We based our research on more than 28,000 facilities available in Yardi Matrix out of an estimated stock of over 50,000 on a national level.
- Population data was taken from the U.S. Census.



Moving From a House to an Apartment: What to Expect, How to Downsize & How Self Storage Helps
For some, moving from a house to an apartment is a financial decision. For others, it’s about simplifying life. Maybe the kids have moved out and half the house sits empty, or you’re approaching retirement and no longer want to spend weekends on repairs. Or perhaps you’ve been weighing the cost of buying a home and wondering whether renting simply makes more sense right now.
Family Heirlooms Overload: How to Handle Family Inheritance Without Regret
Handling family heirlooms after a loss requires managing legal authority, emotional pressure and practical logistics at the same time, and the order you take them on matters more than most people expect.
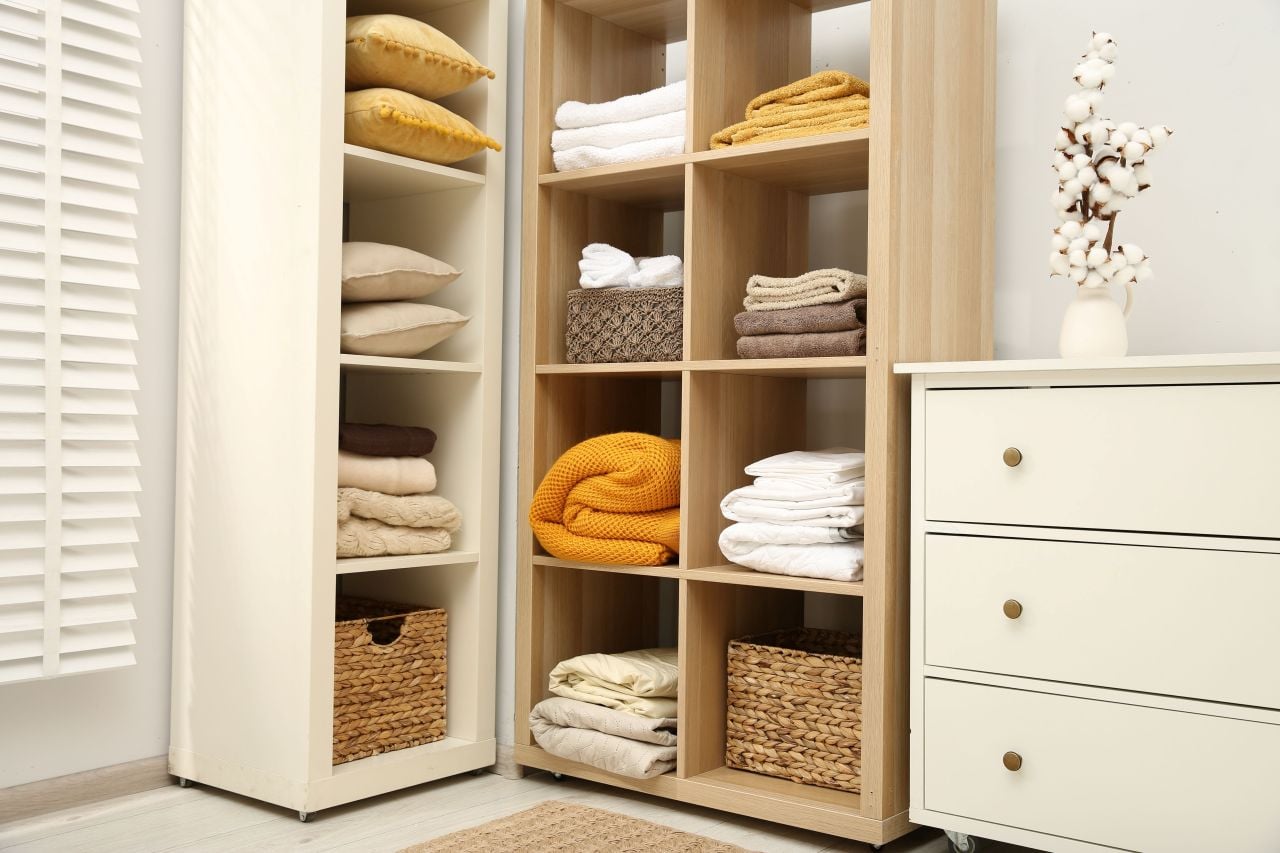
Blanket Storage: The Right Method for Every Space and Season
Blankets make our lives cozier, and storing them well is what keeps them soft and comfortable in the long run. Knowing how to store a blanket properly means your favorites come out of storage smelling fresh, feeling the same as when they went in, and lasting years longer than they otherwise would.

Board Game Storage Ideas That Keep Your Collection in Fighting Shape
Nobody warns you that getting into board games usually unlocks a second hobby, the much dreaded one that includes figuring out where on earth to put them. One game becomes a few, expansions start spawning beside their base boxes and before long, board game storage requires as much strategy as whatever is waiting on the other side of those lids.
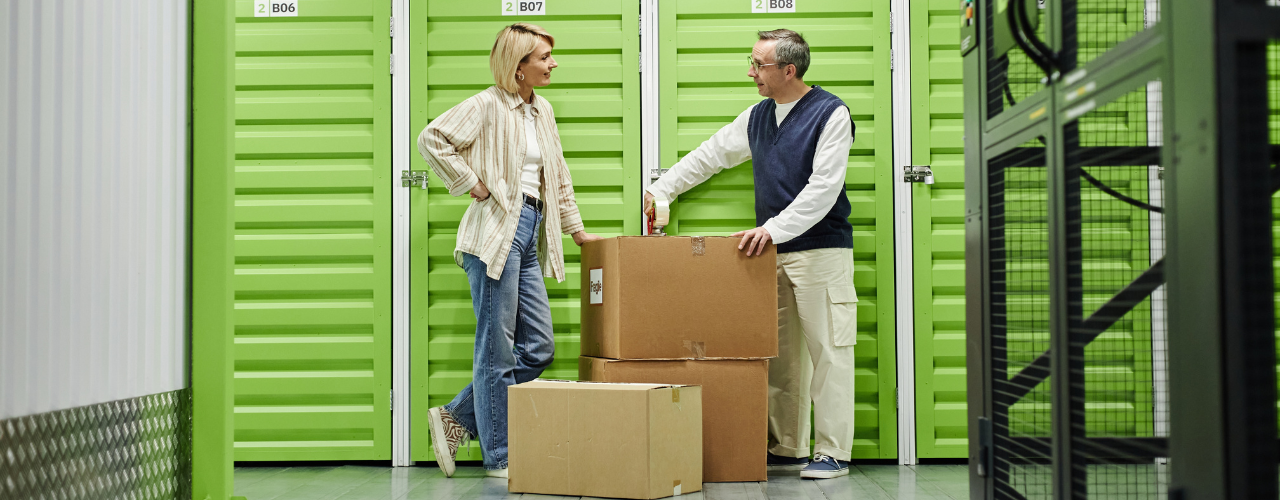
Storage Locker vs. Storage Unit: What’s the Difference?
A locker and a unit may sound like two names for the same four walls and a lock, and depending on the storage facility, you may even see the terms used that way. However, once you start comparing available spaces, storage lockers tend to occupy the smaller end of the spectrum, while storage units(opens in new tab) give you considerably more room to work with.
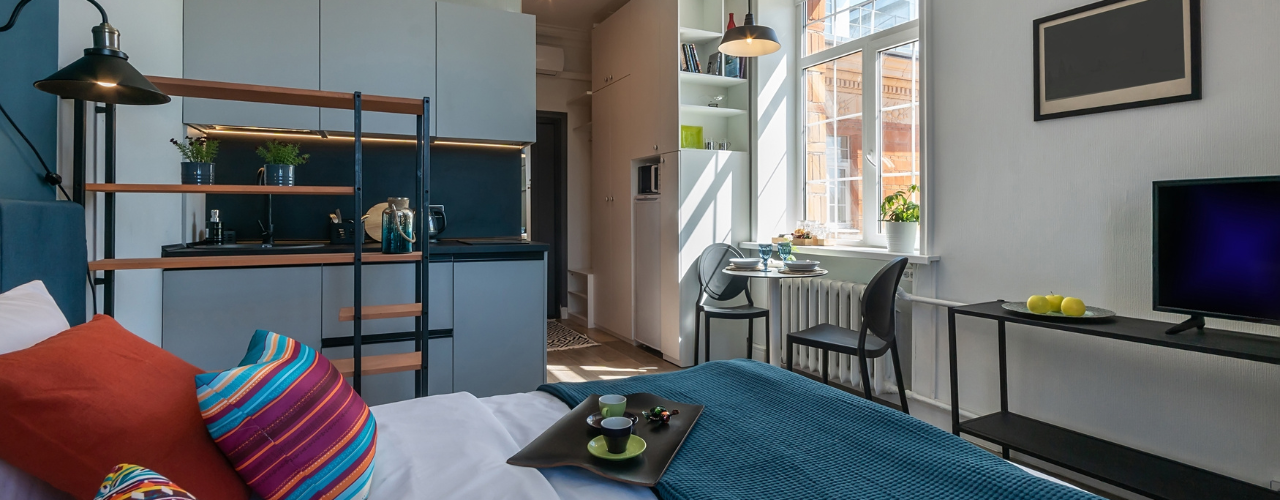
Storage Ideas for Small Spaces: 9 Ways to Max Out Your Home
A messy home contains the seeds of its organization. Those seeds are everywhere: the space above doors, under beds, behind sofas and inside furniture can all become storage. Here are the best storage ideas for small spaces, so you can make the most of your cozy home.

Best U.S. Cities to Live Uncluttered: Plano, TX, Offers the Most Room to Breathe
Clutter is in our homes as much as in our heads. Both are shaped by where we live.
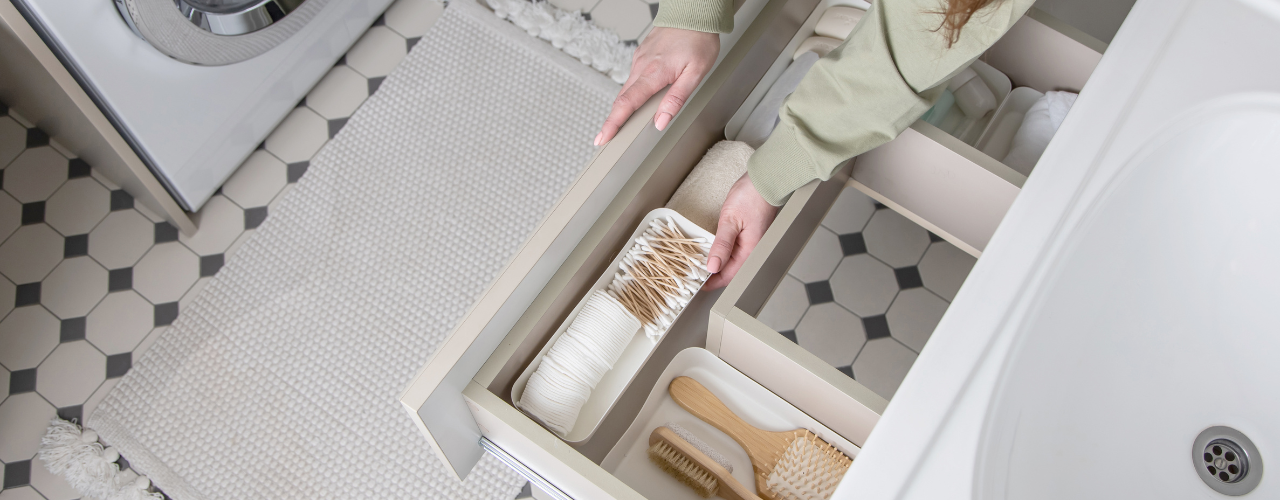
How to Organize Your Bathroom: 8 Ways to Stay Tidy
You already know why an organized bathroom is worth the effort, but let us remind you: it makes rushed mornings easier, keeps counters cleaner and just helps get you in the mood to go through your skincare routine like you should. Plus, in bigger households, it helps everyone find what they need. And you know how much a tidy bathroom counts for your self-esteem when a guest or a partner shows up. Luckily, you don’t need a degree to know how to organize your bathroom. The secret is keeping less, giving every item a home and making that home simple to use. Let’s go through some practical steps can help you create a bathroom that stays functional and nice to look at.

How to Use Silica Gel Packets for Storage
Moisture can cause significant damage to items in storage, leading to rust on tools, mold on clothing and warping in documents. Silica gel uses science to fix that. Often found in small packets inside product packaging, silica gel is a desiccant that absorbs moisture from the air, keeping your stored items dry and protected. This guide explains what silica gel is, how it works and how you can use it to preserve your belongings in self storage.