

New Jersey’s city skylines often steal the spotlight, but the state also has plenty of suburbs offering a taste of urban living without the constant frenzy of the big city. From the picturesque landscapes of Bergen County to the waterfront vistas of Monmouth County, New Jersey suburbs have their own unique character.
For those who crave the energy and convenience of city life but also yearn for the tranquility of suburban neighborhoods, New Jersey offers access to a variety of charming communities that blend the best of both worlds. To identify the best suburbs for a city-like living in New Jersey, we analyzed 45 of the most popular ones in the state, with a population from 10K to 100K.
We looked at indicators such as housing diversity and affordability, demographics, business prowess, shopping and dining options, as well as health and education related amenities. The goal is to pinpoint those suburbs that manage to provide their residents with a thriving, exciting environment – while also allowing them space to breathe and relax. With no further ado, here are New Jersey’s top 10 suburbs for city-like living:

1. Franklin Lakes, New Jersey
Strongest points:
- Business
- Education
- Health
Located in the Bergen County, Franklin Lakes is celebrated for its affluent neighborhoods and scenic landscapes, offering a tranquil setting with top-notch schools and easy access to natural attractions like lakes and reserves.
With a population of just over 11,000, Franklin Lakes tops the charts in several categories that appeal to families seeking suburban living. It’s ranked the best suburb for city-like living in New Jersey, boasting excellent housing affordability with 93% single-family homes and spacious properties. The suburb is still evolving, as seen in the 7.2 building permits issued in 2022 for every 1,000 residents.
The median household income of over $188,000 positions Franklin Lakes as the community with the strongest economic stability in our ranking, while its top-notch education index and life expectancy reflect its commitment to resident well-being.
2. Fair Lawn, New Jersey
Strongest points:
- Health
- Business
- Education
Fair Lawn, a borough positioned 12 miles northwest of New York City, impresses with its excellent schools, expansive parks, and recreational amenities. The housing landscape in Fair Lawn presents a diverse array of options, with single-family homes comprising 80% of the housing stock, alongside townhouses and apartments.
The community in Fair Lawn thrives with many cultural events and activities held throughout the year. Additionally, boasting 2.5 retail stores and 2.1 restaurants per 1,000 residents, the borough offers abundant options for leisure and entertainment. Fair Lawn also excels in park space allocation, providing nearly 600 square feet of park space per capita. The borough also earns high marks in the accessibility of healthcare and social assistance services, with 5.1 facilities available for every 1,000 residents. Its robust business landscape further enhances its appeal, with over 32 businesses per 1,000 residents.
3. Westwood, New Jersey

Strongest points:
- Safety
- Transportation
- Health
Westwood, a picturesque borough renowned for its quaint atmosphere and bustling downtown hub, presents a diverse range of housing options, from historic residences to contemporary developments. Single-family homes constitute 62% of the borough’s housing inventory, with the rest represented by multifamily units, amplifying access to housing for newcomers.
Residents of Westwood may revel in shopping, dining, and cultural experiences available in the vibrant downtown district. Westwood offers 4.2 retail stores and 2.6 restaurants per 1,000 residents, ensuring a wealth of options for leisure and entertainment.
While car dependency remains relatively high at 76.5%, the average commute time stands at a reasonable 29.2 minutes. Westwood is one of the safest suburbs among those analyzed, which, alongside its well-performing healthcare and social assistance system, makes it an excellent choice for young families.
4. Fort Lee, New Jersey

Strongest points:
- Residential
- Health
- Demographics
Perched alongside the scenic Hudson River, Fort Lee boasts stunning views of the iconic Manhattan skyline. This community, home to nearly 40,000 residents, offers great diversity with its blend of residential, commercial and recreational amenities.
Fort Lee’s urban ambiance is palpable, characterized by a high population density of nearly 16,000 people per square mile and an abundance of city-like conveniences, including 3.5 retail stores and 3.5 restaurants per 1,000 residents.
Fort Lee excels in the healthcare sector, boasting the third-best health index among the analyzed suburbs. With 5.4 healthcare and social assistance facilities per 1,000 residents, alongside low obesity rates and a remarkable life expectancy exceeding 82 years, the borough checks all the “healthy living” boxes.
Moreover, the borough offers seamless access to New York City via bridges, ferries and public transportation, with a modest car dependency rate of only 57%—one of the lowest among the locations included in our research.
5. Ridgefield, New Jersey
Strongest points:
- Health
- Amenities
- Education
Ridgefield offers a diverse range of housing options, with single-family homes and multifamily units equally represented in the local inventory. The population of nearly 11,500 residents has an outstanding entrepreneurial spirit, with 46.6 businesses / 1,000 people.
Ridgefield doesn’t fall short on amenities, boasting nearly 115 square feet of park space per capita, along with seven retail stores and 2.8 restaurants for every 1,000 residents. The town also provides recreational facilities and hosts community events for residents to enjoy.
With convenient access to major highways for commuting to nearby cities, Ridgefield boasts an average commute time of 30 minutes, making it an ideal location for those seeking both tranquility and accessibility.
6. Hackensack, New Jersey
Strongest points:
- Health
- Residential
- Amenities
Located as the county seat of Bergen County, Hackensack offers a unique blend of urban and suburban amenities. Its diverse neighborhoods provide an opportunity to discover various cultures, religions, languages and cuisines. The residential sector heavily leans toward multifamily units, with just 12% of the local housing inventory being single family homes, contributing to the city-like vibe of this suburb.
The business sector in Hackensack is well developed, boasting nearly 52 businesses per 1,000 people, the third highest among the suburbs considered for this research. Additionally, the city provides ample office and coworking spaces, catering to the needs of remote workers.
Convenience is paramount in Hackensack, with shopping centers easily accessible, totaling about 5.2 retail stores per 1,000 people. There’s an abundance of dining options scattered throughout the city, with 2.8 restaurants per 1,000 people.
Hackensack also excels in the healthcare sector, ranking second in the health index due to its Hackensack University Medical Center, one of the largest hospitals in the state. Moreover, the city offers 7.3 healthcare and social assistance facilities per 1,000 people.
7. Red Bank, New Jersey
Strongest points:
- Amenities
- Business
- Health
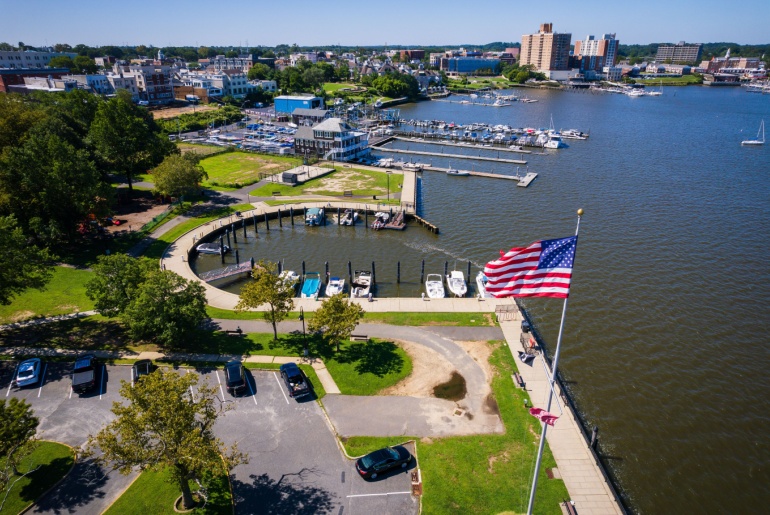
Red Bank, often dubbed the ‘Greenwich Village of the Garden State,’ is a vibrant borough in Monmouth County, with a rich culinary scene, thriving art culture, chic boutiques and eclectic dining options. At the heart of Red Bank’s allure lies its vibrant arts and music scene, anchored by institutions like the Two River Theater and the Count Basie Theater. The borough plays host to an array of events and festivals year-round, drawing crowds from far and wide.
Retail therapy enthusiasts will find themselves in paradise in Red Bank, with offerings ranging from high-end couture to trendy boutiques, vintage stores, and exclusive retail outlets. With 5.8 retail stores and an impressive 4.1 restaurants per 1,000 residents, the borough claims the top spot for amenities. The entrepreneurial spirit is flourishing as well, with a staggering 57.3 enterprises per 1,000 residents.
Art aficionados will delight in Red Bank’s plethora of traditional and contemporary galleries, exceptional theaters and vibrant art collectives. With a calendar brimming with events and workshops, there’s never a dull moment in the downtown district.
Further enhancing its appeal, Red Bank excels in healthcare access, providing 7.3 healthcare and social assistance facilities per 1,000 residents.
8. Woodbridge, New Jersey
Strongest points:
- Amenities
- Business
- Residential
With its diverse population and housing options, including single-family homes and apartments, Woodbridge offers a lifestyle suited to various preferences. The township’s recreational facilities and amenities are evident in its numerous shopping centers (9.3 retail establishments per 1,000 residents) restaurants (3.6 for every 1,000 people), and other recreational facilities, making it an attractive place to live and visit.
In recent years, Woodbridge has experienced significant population growth, with a 13% increase over the past five years leading up to 2022. This growth underscores the township’s appeal as one of the fastest-growing suburbs in New Jersey, reflecting its desirability as a residential destination.
Woodbridge is renowned for its historic sites, which provide insight into its rich heritage. Residents and visitors alike can explore landmarks such as the Proprietary House, the oldest remaining official governor’s residence in the United States, dating back to the colonial era. Additionally, the historic Barron Arts Center offers exhibitions and cultural events that celebrate the township’s history and artistic legacy.
Nature enthusiasts will appreciate Woodbridge’s extensive park space and nature preserves, which offer opportunities for outdoor recreation and relaxation. With 334.6 square feet of park space per capita, residents and visitors alike can enjoy activities such as hiking, picnicking and birdwatching in serene natural settings. Notable nature preserves include the Cheesequake State Park, known for its diverse ecosystems and scenic trails that wind through forests, marshes, and tidal wetlands.
Woodbridge also benefits from its strategic location near major highways and public transportation options, enhancing residents’ mobility and quality of life.
9. Tinton Falls, New Jersey
Strongest points:
- Amenities
- Education
- Health
Tinton Falls, located in Monmouth County, is a suburban enclave renowned for its picturesque landscapes and varied housing choices, including single-family residences, townhouses and condominiums. Additionally, the town features the second-best housing affordability to income ratio among the suburbs analyzed.
Nature enthusiasts flock to Tinton Falls for its abundant parks, trails and outdoor recreational opportunities. With an impressive 2840 square feet of park space per capita, the borough ranks second among New Jersey suburbs with the highest amount of green space per capita. Residents and visitors can immerse themselves in the natural beauty of locales like Hockhockson Park, which offers serene settings for hiking, picnicking and wildlife observation.
In addition to its natural attractions, Tinton Falls provides convenient access to nearby beaches, further enhancing its appeal for outdoor enthusiasts. With 5.1 shopping centers and 2.1 restaurants per 1,000 residents, the suburb offers a diverse array of retail and dining options to suit various tastes and preferences.
Furthermore, Tinton Falls excels in the education sector, boasting one of the highest education indices among the analyzed suburbs. With 0.4 schools per capita, the borough prioritizes quality education for its residents, contributing to its reputation as a family-friendly community.
10. Secaucus, New Jersey
Strongest points:
- Business
- Amenities
- Education
Secaucus is a suburban town renowned for its strategic location and great transportation network. With a population exceeding 21,000 residents, the town has experienced significant growth, with a notable 14% increase in population over a five-year period, resulting in a population density of 3,680 people per square mile.
Secaucus boasts the highest business index among its peers, with an impressive 46.6 businesses per 1,000 people. With a median household income surpassing $125,000 and ample office and coworking spaces, the town fosters a dynamic business environment.
In addition to its entrepreneurial prowess, Secaucus offers a wealth of attractions for residents and visitors alike. From shopping outlets and restaurants to entertainment venues, the town provides diverse leisure options to suit various tastes and interests.
Additionally, Secaucus excels in providing convenient access to neighboring cities, including New York City, thanks to its well-developed transportation infrastructure. With highways, trains and buses connecting the town to major urban centers, residents enjoy seamless commuting options, contributing to a relatively low car dependency rate of only 55.2% compared to other analyzed suburbs.
45 New Jersey Suburbs Ranked by Ranked by City-Living Flair
| Suburb | Rank | Housing Affordability Index | Building Permits* | Single Family Homes % | Population Change (5 years) | Population Density (people/sq. mi.) | Businesses* | Median Household Income | Office and Coworking Space Index | Retail Stores* | Restaurants* | Park Space/ Capita (sq. ft.) | Health Care & Social Assistance Access* | Obesity | Life Expectancy | Education Index | Crime Rate | Car Usage | Commute Time | Self Storage per Capita | Self Storage Rent |
|---|---|---|---|---|---|---|---|---|---|---|---|---|---|---|---|---|---|---|---|---|---|
| Franklin Lakes, NJ | 1 | 107 | 7.2 | 93% | 2% | 1,172 | 32.7 | 188272 | 166 | 3.3 | 1.7 | 244.6 | 3.4 | 23% | 82.3 | 2.0 | 0.7% | 66.1% | 35.0 | 2.5 | 204.0 |
| Fair Lawn, NJ | 2 | 180 | 6.2 | 80% | 5% | 6,781 | 32.3 | 133209 | 294 | 2.5 | 2.1 | 587.4 | 5.1 | 23% | 82.3 | 17.8 | 0.8% | 71.3% | 33.6 | 1.0 | 154.5 |
| Westwood, NJ | 3 | 194 | 1.2 | 62% | 1% | 4,988 | 34.6 | 136603 | 310 | 4.2 | 2.6 | 237.0 | 4.1 | 23% | 82.3 | 15.3 | 0.5% | 76.5% | 29.2 | 1.5 | 129.2 |
| Fort Lee, NJ | 4 | 213 | 3.2 | 20% | 8% | 15,767 | 42.4 | 92456 | 194 | 3.5 | 3.5 | 34.4 | 5.4 | 23% | 82.3 | 23.5 | 1.1% | 57.4% | 36.8 | 0.4 | 213.0 |
| Ridgefield, NJ | 5 | 193 | 2.8 | 50% | 2% | 4,513 | 46.6 | 93045 | 413 | 7.0 | 2.8 | 114.8 | 2.9 | 23% | 82.3 | 14.5 | 0.8% | 82.3% | 30.4 | 0.7 | 129.7 |
| Hackensack, NJ | 6 | 242 | 11.4 | 22% | 3% | 10,910 | 51.8 | 73716 | 169 | 5.2 | 2.8 | 100.7 | 7.3 | 23% | 82.3 | 26.3 | 1.4% | 67.3% | 31.3 | 1.9 | 153.5 |
| Red Bank, NJ | 7 | 219 | 2.4 | 51% | 5% | 7,345 | 57.3 | 80781 | 66 | 5.8 | 4.1 | 117.5 | 9.5 | 22% | 79.8 | 22.8 | 1.2% | 75.7% | 31.1 | 1.8 | 234.0 |
| Woodbridge, NJ | 8 | 204 | 6.6 | 50% | 13% | 5,483 | 42.7 | 96919 | 173 | 9.3 | 3.6 | 334.6 | 2.6 | 24% | 80.7 | 28.5 | 1.4% | 77.9% | 31.0 | 1.1 | 157.0 |
| Tinton Falls, NJ | 9 | 149 | 2.2 | 66% | 6% | 1,231 | 29.4 | 96294 | 321 | 5.1 | 2.0 | 2840.1 | 3.9 | 22% | 79.8 | 10.8 | 1.4% | 83.4% | 29.3 | 0.9 | 154.1 |
| Secaucus, NJ | 10 | 214 | 0.3 | 36% | 14% | 3,680 | 46.5 | 125246 | 165 | 4.9 | 3.2 | 445.1 | 3.1 | 26% | 79.8 | 12.8 | 2.0% | 55.2% | 34.3 | 0.6 | 169.9 |
| Oakland, NJ | 11 | 155 | 0.4 | 96% | -2% | 1,502 | 32.9 | 152283 | 451 | 3.4 | 2.2 | 343.4 | 3.2 | 23% | 82.3 | 7.5 | 0.7% | 81.5% | 30.7 | 0.6 | 206.0 |
| South Plainfield, NJ | 12 | 157 | 3.0 | 84% | 1% | 2,923 | 34.7 | 114293 | 165 | 3.2 | 2.2 | 333.8 | 5.2 | 24% | 80.7 | 19.0 | 1.3% | 85.2% | 28.5 | 0.5 | 156.8 |
| Edgewater, NJ | 13 | 245 | 1.2 | 14% | 19% | 14,659 | 36.9 | 126483 | 587 | 5.7 | 4.7 | 73.5 | 4.7 | 23% | 82.3 | 31.8 | 1.1% | 42.9% | 43.6 | 0.0 | 201.7 |
| Hasbrouck Heights, NJ | 14 | 186 | 1.1 | 66% | 0% | 7,958 | 31.8 | 102639 | 295 | 3.7 | 2.9 | 52.3 | 2.4 | 22% | 79.8 | 16.0 | 0.2% | 74.9% | 30.1 | 0.5 | 163.7 |
| Metuchen, NJ | 15 | 182 | 0.5 | 76% | 8% | 5,224 | 33.5 | 141915 | 406 | 3.2 | 2.1 | 124.4 | 4.2 | 24% | 80.7 | 12.5 | 1.4% | 59.8% | 38.5 | 0.8 | 152.5 |
| Hoboken, NJ | 16 | 265 | 0.9 | 4% | 12% | 47,495 | 29.2 | 160890 | 155 | 3.2 | 3.6 | 30.7 | 2.6 | 26% | 79.8 | 15.5 | 1.6% | 21.1% | 38.2 | 0.3 | 313.0 |
| Lakewood, NJ | 17 | 181 | 23.0 | 68% | 22% | 9,430 | 32.5 | 52222 | 390 | 5.0 | 0.8 | 674.7 | 2.5 | 31% | 78.4 | 23.0 | 0.9% | 80.9% | 21.1 | 2.5 | 145.7 |
| Little Ferry, NJ | 18 | 212 | 7.8 | 46% | 1% | 7,429 | 25.6 | 77368 | 532 | 4.0 | 1.7 | 285.2 | 0.7 | 23% | 82.3 | 26.8 | 0.5% | 78.4% | 28.2 | 0.4 | 171.0 |
| Englewood, NJ | 19 | 221 | 1.2 | 47% | 3% | 5,915 | 43.0 | 91164 | 370 | 5.2 | 2.0 | 93.3 | 8.4 | 23% | 82.3 | 32.0 | 1.3% | 66.6% | 30.2 | 1.2 | 198.2 |
| Toms River, NJ | 20 | 171 | 2.2 | 83% | 4% | 2,354 | 29.4 | 85752 | 463 | 4.1 | 2.3 | 781.9 | 4.5 | 31% | 78.4 | 20.5 | 1.1% | 88.8% | 30.1 | 3.4 | 141.2 |
| Totowa, NJ | 21 | 193 | 2.7 | 80% | 1% | 2,753 | 55.3 | 103419 | 189 | 7.7 | 2.9 | 69.5 | 4.1 | 30% | 79.3 | 30.5 | 1.8% | 84.8% | 29.2 | 2.4 | 152.0 |
| Lodi, NJ | 22 | 214 | 0.4 | 27% | 5% | 11,436 | 21.9 | 70821 | 651 | 3.4 | 1.8 | 22.6 | 1.1 | 23% | 82.3 | 25.8 | 0.8% | 79.7% | 28.8 | 0.7 | 150.7 |
| Hawthorne, NJ | 23 | 187 | 2.8 | 59% | 3% | 5,877 | 28.1 | 107416 | 733 | 2.9 | 2.0 | 284.5 | 2.2 | 30% | 79.3 | 24.5 | 0.9% | 87.4% | 25.3 | 0.5 | 184.5 |
| North Arlington, NJ | 24 | 241 | 0.0 | 41% | 3% | 6,578 | 19.5 | 94012 | 725 | 2.5 | 2.2 | 186.1 | 1.8 | 23% | 82.3 | 25.5 | 0.7% | 75.4% | 33.5 | 0.3 | 167.3 |
| Clifton, NJ | 25 | 199 | 3.7 | 51% | 5% | 7,937 | 27.8 | 86616 | 392 | 3.3 | 1.8 | 112.9 | 4.0 | 30% | 79.3 | 28.3 | 1.7% | 82.2% | 28.1 | 1.3 | 170.6 |
| Bergenfield, NJ | 26 | 186 | 2.3 | 72% | 3% | 9,739 | 19.4 | 111851 | 670 | 2.8 | 1.2 | 58.7 | 1.9 | 23% | 82.3 | 28.5 | 0.4% | 77.5% | 35.1 | 0.3 | 171.7 |
| Garfield, NJ | 27 | 208 | 0.6 | 26% | 3% | 15,387 | 19.1 | 66296 | 730 | 2.4 | 1.4 | 62.9 | 0.8 | 23% | 82.3 | 10.0 | 1.2% | 78.8% | 29.0 | 1.2 | 178.9 |
| Dover, NJ | 28 | 181 | 0.0 | 59% | 1% | 6,883 | 22.0 | 69434 | 423 | 2.7 | 1.8 | 351.0 | 1.5 | 21% | 82.0 | 30.0 | 0.7% | 84.6% | 27.3 | 2.2 | 160.0 |
| Linden, NJ | 29 | 193 | 9.0 | 50% | 4% | 4,059 | 27.8 | 80200 | 666 | 4.3 | 1.8 | 140.3 | 1.4 | 30% | 80.2 | 28.8 | 2.9% | 82.9% | 31.3 | 1.4 | 150.6 |
| Bayonne, NJ | 30 | 249 | 9.8 | 21% | 7% | 12,120 | 17.3 | 72839 | 684 | 2.6 | 1.7 | 104.8 | 2.0 | 26% | 79.8 | 22.0 | 1.2% | 60.6% | 34.8 | 1.6 | 230.4 |
| New Brunswick, NJ | 31 | 201 | 0.9 | 31% | -1% | 10,638 | 18.9 | 49338 | 133 | 2.1 | 2.4 | 136.0 | 1.4 | 24% | 80.7 | 28.8 | 2.2% | 65.5% | 27.5 | 0.9 | 122.7 |
| Fairview, NJ | 32 | 216 | 5.4 | 28% | 4% | 17,675 | 26.7 | 54904 | 704 | 3.9 | 2.5 | 9.0 | 0.6 | 22% | 79.8 | 41.5 | 1.0% | 70.5% | 31.9 | 0.1 | 156.8 |
| Plainfield, NJ | 33 | 201 | 5.0 | 45% | 7% | 9,093 | 16.4 | 63750 | 566 | 2.8 | 1.5 | 264.4 | 1.0 | 30% | 80.2 | 22.3 | 1.9% | 72.0% | 32.5 | 0.9 | 175.0 |
| Harrison, NJ | 34 | 220 | 12.6 | 10% | 25% | 15,544 | 16.0 | 68494 | 549 | 1.7 | 1.8 | 105.0 | 1.0 | 26% | 79.8 | 27.0 | 1.6% | 41.8% | 37.7 | 0.1 | 177.0 |
| Ringwood, NJ | 35 | 159 | 2.0 | 99% | -5% | 460 | 21.2 | 130833 | 781 | 1.6 | 1.1 | 51464.5 | 1.1 | 30% | 79.3 | 14.3 | 0.2% | 85.3% | 35.1 | 1.1 | 149.0 |
| Sayreville, NJ | 36 | 207 | 2.6 | 65% | 2% | 2,847 | 18.0 | 89600 | 311 | 2.1 | 1.4 | 282.3 | 1.0 | 24% | 80.7 | 29.0 | 0.7% | 80.9% | 34.1 | 1.6 | 184.5 |
| Rahway, NJ | 37 | 235 | 6.7 | 56% | 2% | 7,593 | 19.3 | 81368 | 607 | 2.1 | 1.9 | 357.4 | 1.4 | 30% | 80.2 | 35.0 | 0.8% | 77.6% | 32.0 | 0.8 | 330.0 |
| Roselle, NJ | 38 | 207 | 7.4 | 56% | 5% | 8,543 | 15.7 | 68369 | 734 | 2.7 | 1.3 | 403.8 | 0.6 | 30% | 80.2 | 24.8 | 1.2% | 74.5% | 30.8 | 0.4 | 206.0 |
| Glassboro, NJ | 39 | 242 | 4.4 | 70% | 6% | 2,176 | 18.2 | 71608 | 728 | 3.5 | 2.2 | 187.3 | 0.9 | 32% | 77.6 | 11.0 | 1.5% | 80.3% | 29.0 | 1.6 | 155.6 |
| Kearny, NJ | 40 | 221 | 0.0 | 36% | -1% | 4,725 | 22.9 | 76647 | 268 | 2.6 | 1.6 | 113.6 | 1.0 | 26% | 79.8 | 21.0 | 1.3% | 75.5% | 31.8 | 0.2 | 195.2 |
| Phillipsburg, NJ | 41 | 283 | 1.1 | 73% | 4% | 4,746 | 22.7 | 57292 | 574 | 3.5 | 1.9 | 167.9 | 3.3 | 30% | 80.0 | 20.5 | 1.9% | 87.2% | 29.3 | 3.2 | 145.3 |
| Wallington, NJ | 42 | 262 | 0.2 | 25% | 2% | 11,904 | 18.8 | 75410 | 664 | 2.3 | 1.3 | 136.0 | 0.9 | 23% | 82.3 | 29.8 | 1.3% | 81.4% | 29.9 | 0.1 | 166.0 |
| Carteret, NJ | 43 | 177 | 2.7 | 54% | 5% | 5,711 | 16.9 | 74583 | 748 | 2.0 | 0.9 | 323.5 | 0.6 | 24% | 80.7 | 33.8 | 1.3% | 81.7% | 30.0 | 0.7 | 207.0 |
| Passaic, NJ | 44 | 216 | 1.4 | 17% | 0% | 22,441 | 17.9 | 49436 | 741 | 3.5 | 1.4 | 50.5 | 1.3 | 30% | 79.3 | 35.3 | 1.9% | 65.5% | 26.2 | 0.4 | 145.3 |
| Bellmawr, NJ | 45 | 259 | 0.0 | 75% | 1% | 3,898 | 19.3 | 66667 | 539 | 2.7 | 1.3 | 118.9 | 0.5 | 31% | 77.8 | 29.0 | 1.7% | 88.0% | 24.7 | 1.2 | 116.3 |
StorageCafe analysis of U.S. Census, Yardi Matrix, Commercial Edge, Coworkingcafe, Department of Education, Centers for Disease Control and Prevention, FBI and Trust for Public Land data
Methodology
This analysis was done by StorageCafe, an online platform that provides storage unit listings across the nation.
To determine the top suburbs that offer the best urban and suburban living combined, we ranked 45 major suburbs located in New Jersey. We considered a suburb any place located within a large metro area and with a population of between 10,000 and 100,000 inhabitants.
The ranking is based on the suburbs’ overall scores. Overall scores represent an average of all the suburbs’ weighted scores based on the metrics presented below.
To calculate the number of retail stores, restaurants and health care and social assistance establishments related to population, we used U.S. Census data and made estimates based on ZIP code data.
To assess education, we created a ranking based on standardized test results, numbers of public schools per 1,000 locals and student-to-teacher ratios.
Obesity rates and life expectancy were calculated based on county-level data from the CDC.
The data on self storage costs was taken from Yardi Matrix, StorageCafe‘s sister division and a business development and asset management tool for brokers, sponsors, banks and equity sources underwriting investments in the multifamily, office, industrial and self storage sectors.
Fair use and distribution
This study serves as a resource for the general public on issues of common interest and should not be regarded as investment advice. The data is true to the best of our knowledge but may change if amendments to it are made. We agree to the distribution of this content but we do require a mention in return for attribution purposes.



Moving From a House to an Apartment: What to Expect, How to Downsize & How Self Storage Helps
For some, moving from a house to an apartment is a financial decision. For others, it’s about simplifying life. Maybe the kids have moved out and half the house sits empty, or you’re approaching retirement and no longer want to spend weekends on repairs. Or perhaps you’ve been weighing the cost of buying a home and wondering whether renting simply makes more sense right now.
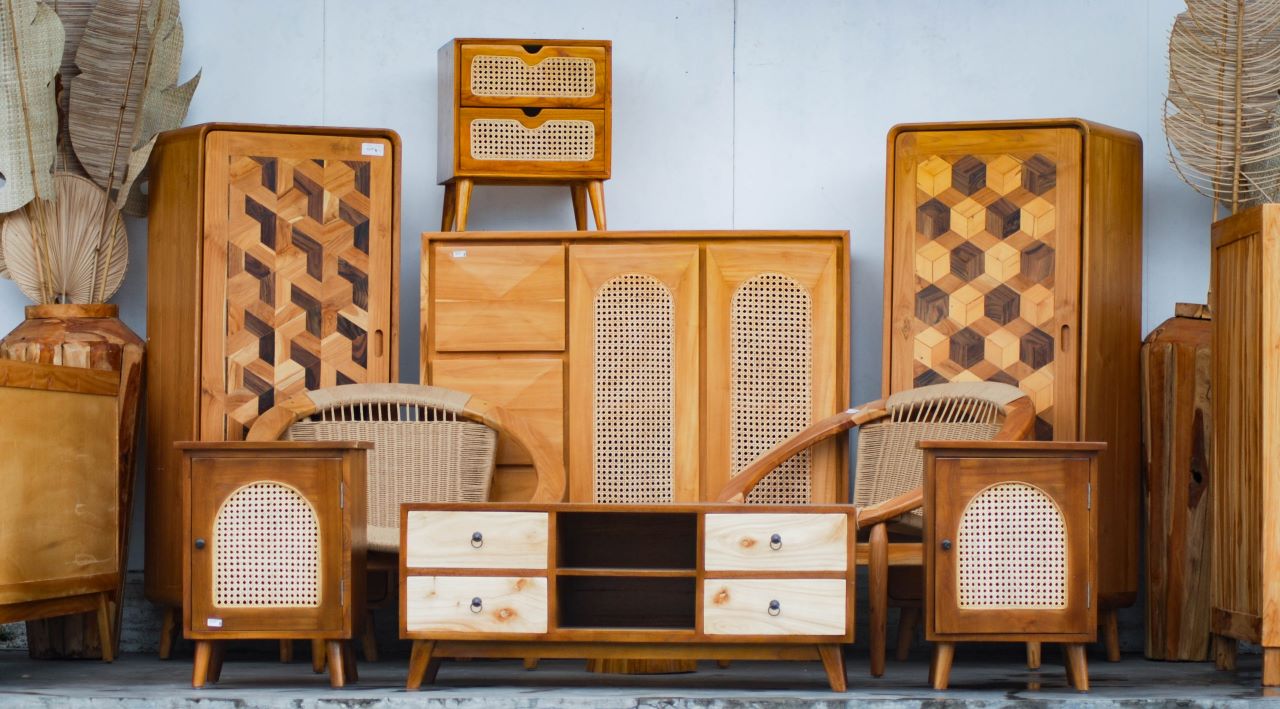
Family Heirlooms Overload: How to Handle Family Inheritance Without Regret
Handling family heirlooms after a loss requires managing legal authority, emotional pressure and practical logistics at the same time, and the order you take them on matters more than most people expect.
Blanket Storage: The Right Method for Every Space and Season
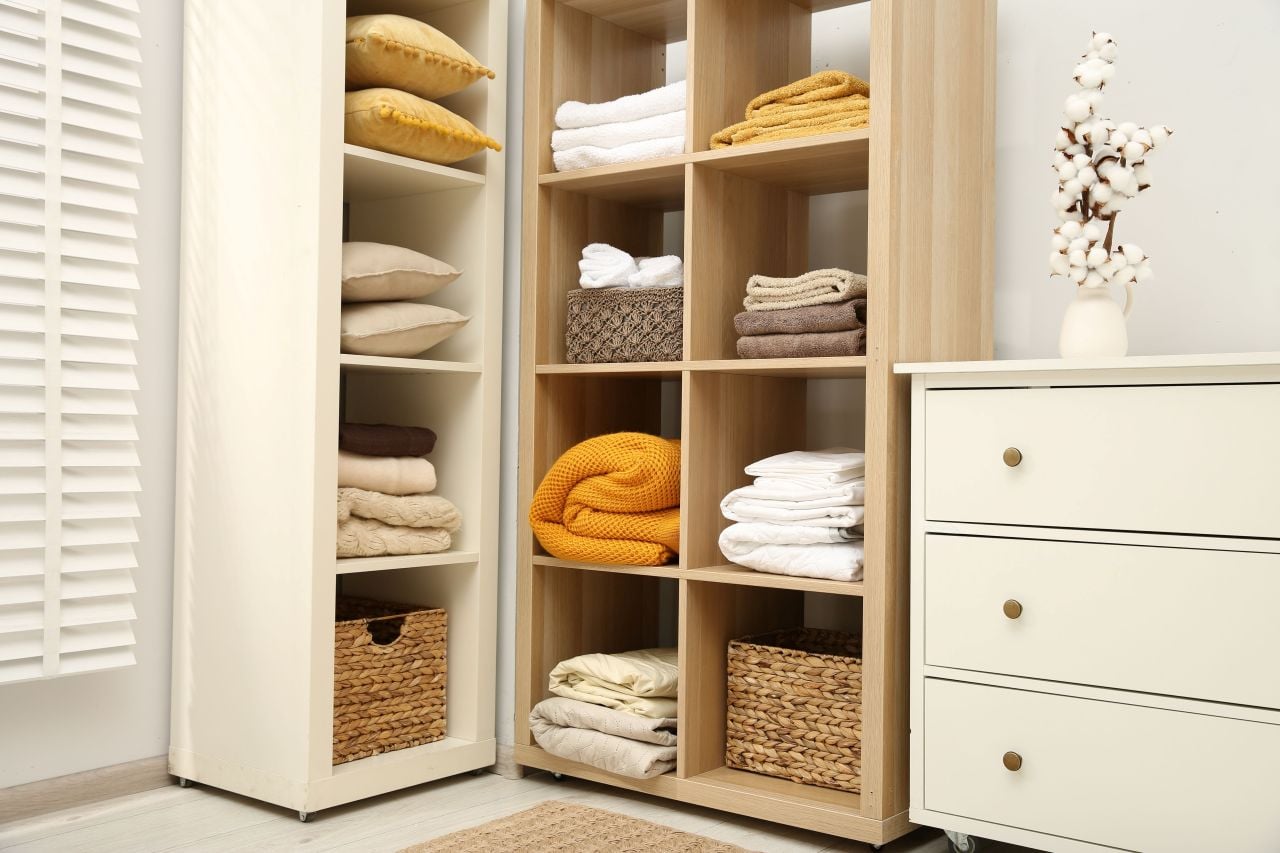
Blankets make our lives cozier, and storing them well is what keeps them soft and comfortable in the long run. Knowing how to store a blanket properly means your favorites come out of storage smelling fresh, feeling the same as when they went in, and lasting years longer than they otherwise would.

Board Game Storage Ideas That Keep Your Collection in Fighting Shape
Nobody warns you that getting into board games usually unlocks a second hobby, the much dreaded one that includes figuring out where on earth to put them. One game becomes a few, expansions start spawning beside their base boxes and before long, board game storage requires as much strategy as whatever is waiting on the other side of those lids.

Storage Locker vs. Storage Unit: What’s the Difference?
A locker and a unit may sound like two names for the same four walls and a lock, and depending on the storage facility, you may even see the terms used that way. However, once you start comparing available spaces, storage lockers tend to occupy the smaller end of the spectrum, while storage units(opens in new tab) give you considerably more room to work with.
Storage Ideas for Small Spaces: 9 Ways to Max Out Your Home
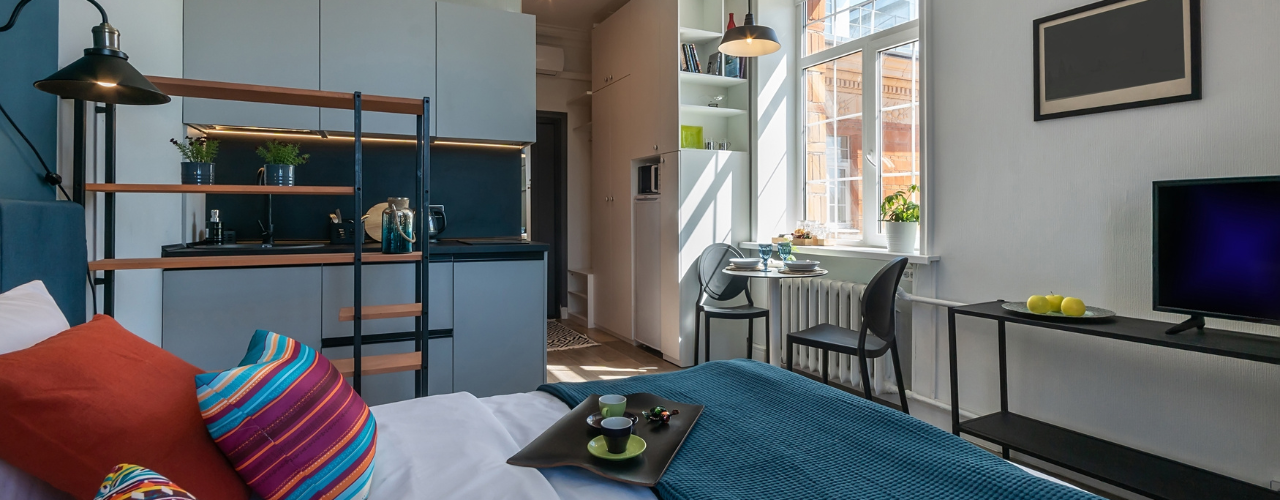
A messy home contains the seeds of its organization. Those seeds are everywhere: the space above doors, under beds, behind sofas and inside furniture can all become storage. Here are the best storage ideas for small spaces, so you can make the most of your cozy home.
Best U.S. Cities to Live Uncluttered: Plano, TX, Offers the Most Room to Breathe
Clutter is in our homes as much as in our heads. Both are shaped by where we live.
How to Organize Your Bathroom: 8 Ways to Stay Tidy
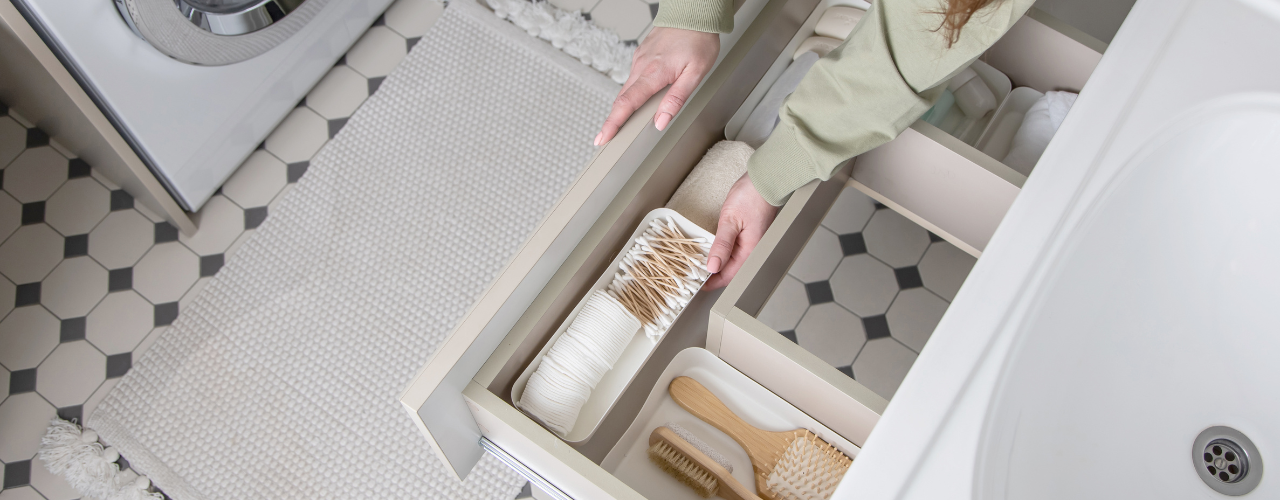
You already know why an organized bathroom is worth the effort, but let us remind you: it makes rushed mornings easier, keeps counters cleaner and just helps get you in the mood to go through your skincare routine like you should. Plus, in bigger households, it helps everyone find what they need. And you know how much a tidy bathroom counts for your self-esteem when a guest or a partner shows up. Luckily, you don’t need a degree to know how to organize your bathroom. The secret is keeping less, giving every item a home and making that home simple to use. Let’s go through some practical steps can help you create a bathroom that stays functional and nice to look at.
How to Use Silica Gel Packets for Storage
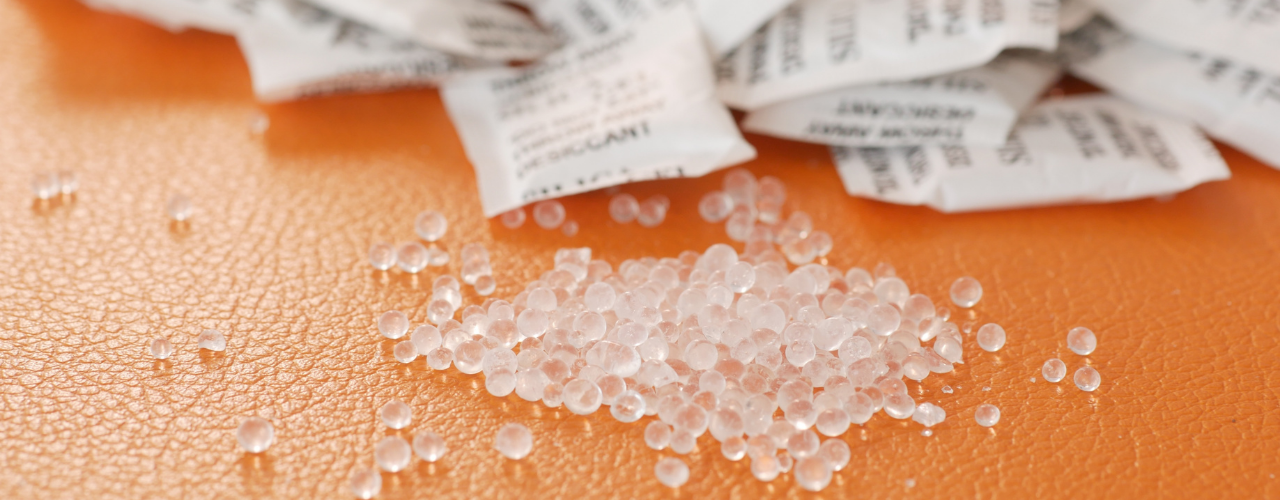
Moisture can cause significant damage to items in storage, leading to rust on tools, mold on clothing and warping in documents. Silica gel uses science to fix that. Often found in small packets inside product packaging, silica gel is a desiccant that absorbs moisture from the air, keeping your stored items dry and protected. This guide explains what silica gel is, how it works and how you can use it to preserve your belongings in self storage.