
Self Storage Sales Reach Nearly $1.6B In Q3 2025 As Transaction Activity Jumps By 62% Compared To Previous Year

- Q3 2025 self storage sales reached nearly $1.6B, up by 62% compared to the same quarter of previous year.
- Florida, California, and Georgia were the top states by total transaction value, each exceeding $200M in Q3 sales.
- New York City led all cities with $90M in transactions, followed by Las Vegas ($76M) and Atlanta ($43M).
- About 22% of Q3 acquisitions involved REITs, which paid an average of $146 per square foot, compared with $133 for non-REIT buyers.
Self storage investment activity picked up pace during the third quarter of 2025, signaling stronger confidence among both private and institutional buyers. The total value of assets that changed hands reached $1.6 billion, compared to $988 million a year earlier, representing a massive increase of 62%. Over 260 facilities changed hands during the quarter, up 32% from Q3 2024 transactions. The amount of space traded also increased by 44% to 18.4 million square feet.
The rise in both activity and transaction value reflects a broader willingness among buyers to re-enter the market after a period of more cautious acquisition strategies in previous years.
Although the self storage sector continues to be dominated by small and mid-sized owners, institutional activity remained a significant component of Q3 sales. REIT acquisitions totaled nearly $354 million, representing 22% of all Q3 acquisitions. While this share was down from 32% in the previous quarter, the dollar volume actually increased by more than $100 million. REIT-involved purchases averaged $146 per square foot, compared to $133 per square foot in non-REIT purchases.
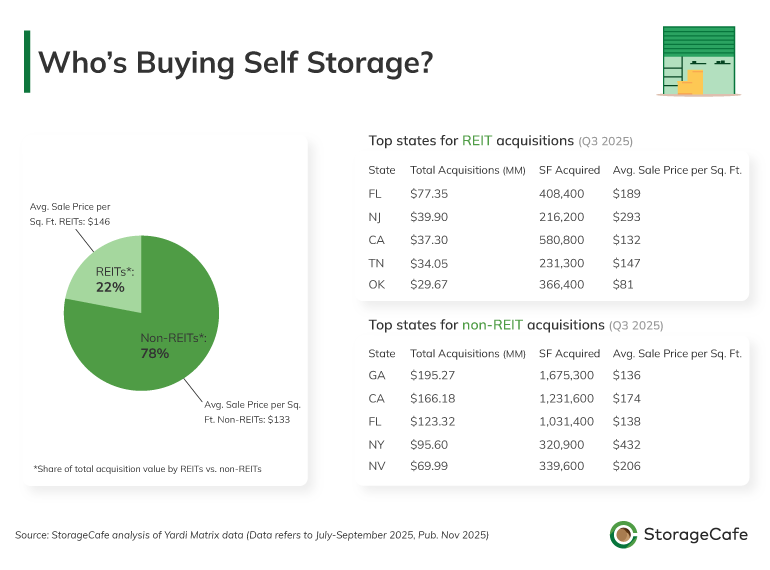
Florida and other southern states remained key targets for REIT buyers, but New Jersey and California also ranked among the top markets for acquisitions. This shift suggests a growing interest among institutional investors in geographic diversification, as well as a willingness to pursue low-supply, high-demand markets where development pipelines are thin, demand fundamentals are strengthening, and barriers to entry help support durable rent growth.
Southern US sees a flurry of transactions
The South remained one of the main engines of self storage acquisitions in Q3, supported by steady population gains and thus continued demand for self storage in Texas, Florida and Georgia. Both Florida and Georgia saw transactions amounting to over $200 million. Texas registered the highest number of transactions nationally but its combined sales volume remained below $50 million, indicating that many of these assets were smaller or more moderately priced compared with those traded in Florida and Georgia.
On the West Coast, California also registered transactions amounting to over $200 million, reflecting renewed buyer interest in high-demand, high-barrier coastal markets.
New York, despite recording fewer total trades, maintained elevated pricing levels per square foot, a reflection of dense suburban markets where land pressures continue to limit new storage construction. The state of New York registers the highest sale price per square foot, at a whopping $382, followed by Utah and Maryland. By contrast, states with more accessible development environments saw lower pricing. Arkansas averaged around $52 per square foot, the lowest level among states that registered sales in Q3 2025, followed by Kentucky and Nebraska.
Top 10 cities for self storage sales in Q3 2025
From major coastal cities to rapidly expanding inland markets, these were the 10 U.S. cities that led the nation in self storage sales during Q3 2025.
1. New York City, NY — $90M
- Scale traded: 208K square feet
- Price: $526 per square foot
- Self storage supply: 2.4 square feet per capita
New York City once again ranked first nationally for overall transaction value. Q3 volume nearly doubled the city’s Q2 totals in both square footage and dollar amount. The largest deal of the quarter occurred in Manhattan, where Storage Post acquired three facilities, including a 97,000-square-foot property on Amsterdam Avenue for $60 million.
Limited land availability, dense housing, and constant household turnover continue to drive exceptional pricing in this undersupplied market.
2. Las Vegas, NV — $76.3M
- Scale traded: 381K square feet
- Price: $200 per square foot
- Self storage supply: 7.8 square feet per capita
Las Vegas, NV recorded transactions totaling $76.3 million, with the average price per square foot hovering around $200. Unlike New York City, self storage availability in Las Vegas is far more widespread and close to 8 square feet per capita, just above the national benchmark. In this context, the pricing demonstrates continued interest in the local storage market. Strong population inflows and ongoing residential and commercial development also contribute to healthy storage utilization. The city’s growing renter population has helped maintain stable occupancy levels across the metro. Most of the Q3 sales in Las Vegas were completed by Etude Capital, which purchased three Extra Space Storage facilities, including one transaction exceeding $32 million.
3. Atlanta, GA — $42.8M
- Scale traded: 332K square feet
- Price: $223 per square foot
- Self storage supply: 4.6 square feet per capita
Atlanta, a relatively undersupplied market with only 4.6 square feet of storage space per capita, recorded nearly $43 million in sales, averaging $223 per square foot. The largest local transaction was a Mini Mall Storage purchase of a 96,000-square-foot facility for $21.7 million. Strong in-migration and a diverse economic base help support stable storage fundamentals across a city that saw a 13% population growth over the past decade.
4. Lakewood, NJ — $31.3M
- Scale traded: 97K square feet
- Price: $324 per square foot
- Self storage supply: 2.2 square feet per capita
Lakewood, an upscale township in fast-growing Ocean County, ranked fourth nationally for self storage transaction value in Q3 2025. The average price of $324 per square foot reflects the area’s very limited supply of just over 2 square feet per capita and is further supported by ongoing residential development in a location that offers convenient access not only to Manhattan, but also to Philadelphia and Jersey City. The township’s rapid population growth, up by roughly one-third over the past decade, along with its young demographic profile and strong household formation rates, continue to fuel consistent demand for storage.
5. Temecula, CA — $28.35M
- Scale traded: 72K square feet
- Price: $363 per square foot
- Self storage supply: 7.2 square feet per capita
Temecula’s transaction volume reflects the Inland Empire’s continued population growth. As more residents move inland from coastal California, demand for self storage has remained steady, while high construction costs and zoning constraints help support facility valuations. Temecula saw notable activity in Q3, highlighted by the acquisition of a major facility by Etude Capital, an operator on a buying spree this past quarter, for $26 million. The purchase included nearly 72,000 square feet of storage space and accounted for the majority of the city’s sales activity this quarter.
6. Snoqualmie, WA — $28M
- Scale traded: 107K square feet
- Price: $263 per square foot
- Self storage supply: 5.1 square feet per capita
Snoqualmie, an affluent suburb east of Seattle, continues to benefit from strong growth along the I-90 corridor. Rising home prices, limited space for new commercial development, and steady household expansion all contribute to solid storage demand. The local population has grown by more than 18% over the past decade, naturally increasing the need for self storage. With supply at roughly 5 square feet per capita, facilities in Snoqualmie command about $263 per square foot. The major transaction this quarter was a $28 million acquisition by RHW Capital Management Group.
7. Newhall, CA — $27M
- Scale traded: 109K square feet
- Price: $247 per square foot
- Self storage supply: 2 square feet per capita
Newhall, in Los Angeles County’s Santa Clarita Valley, recorded $27 million in sales this quarter, including the acquisition of a 109,000-square-foot facility by Intercontinental Real Estate Corporation. This upscale suburb, marked by rapidly expanding neighborhoods, has very limited self storage supply of only about 2 square feet per capita and local rent sits well above the national average at roughly $196 per month. These conditions create strong and sustained demand, keeping occupancy levels consistently high.
8. Brooksville, FL — $26.6M
- Scale traded: 127K square feet
- Price: $210 per square foot
- Self storage supply: 6.4 square feet per capita
Brooksville, FL continues to grow along with the rest of Hernando County, supported by in-migration from other parts of Florida and the Northeast. The population has increased by nearly 20% over the past decade, which has helped drive strong demand for self storage locally. New residential subdivisions and expanding commercial activity have further boosted storage usage. Local inventory now stands at 6.4 square feet per capita, approaching the national benchmark. Several transactions closed in Brooksville during Q3 2025, with pricing averaging around $210 per square foot.
9. Stone Mountain, GA — $25.65M
- Scale traded: 177K square feet
- Price: $145 per square foot
- Self storage supply: 3 square feet per capita
Stone Mountain, located in the eastern part of the Atlanta metro area, illustrates the strong appeal of the self storage sector across Georgia, particularly around Atlanta. The suburb benefits from residential density and steady local demand, with its population rising by 12% over the past decade. A large base of single-family homes and long-established neighborhoods supports regular turnover and a consistent need for storage. Despite this demand, local inventory remains very limited — only 3 square feet per capita — pointing to future development potential. At $145 per square foot, Stone Mountain recorded the lowest pricing among the top 10 cities by transaction volume.
10. Palm Desert, CA — $24.9M
- Scale traded: 71K square feet
- Price: $351 per square foot
- Self storage supply: 7.5 square feet per capita
Palm Desert recorded a major transaction of nearly $25 million, with pricing reaching a strong $351 per square foot. The Coachella Valley’s steadily increasing year-round population has strengthened local storage fundamentals. A mix of vacation properties, retirees, and expanding residential development supports consistent, stable demand. Although the area is relatively well supplied, with more than 7 square feet per capita, roughly in line with the national benchmark, strong demand keeps street rates elevated. Local rents average about $155 per month, well above the national average of $135.
Pricing trends highlight strong interest from buyers in high-barrier markets
The quarter’s highest price-per-square-foot transactions were concentrated in markets where development constraints and strong household density continue to support firm valuations.
New York City recorded trades above $500 per square foot, while several Southern California submarkets saw sales regularly surpass $300 per square foot. In the Seattle metro, Snoqualmie also achieved elevated pricing, supported by limited available land and high local incomes.
In high-barrier coastal markets, particularly in the Northeast, REITs often paid significantly more per square foot than non-REIT buyers, reflecting their preference for higher-grade assets with strong long-term fundamentals. New Jersey offers the clearest example: REIT acquisitions averaged $293 per square foot, compared with $106 for non-REIT trades.
A similar pattern appeared in several southern states, though with narrower gaps. In Georgia, for example, REIT purchases averaged $219 per square foot, compared with $136 for non-REIT buyers, highlighting the wide range of asset types trading in the Atlanta metro and its surrounding suburbs. Florida showed the same tendency: strong population growth and active private-buyer interest kept non-REIT pricing relatively close to REIT levels, suggesting broad competition across asset classes.
In more affordable markets, REITs and non-REIT buyers often paid comparable prices. In Oklahoma, for instance, REIT acquisitions averaged about $81 per square foot, nearly identical to non-REIT pricing at $79.
Overall, REITs paid premiums in markets where long-term resilience and high barriers to entry justify higher valuations, while non-REIT buyers matched REIT pricing in high-growth, development-friendly states.
Transaction activity accelerated across markets and asset types in Q3 2025, supported by both private buyers and institutional investors. With capital flowing back into established metros and fast-growing secondary cities and with financing conditions gradually improving, the sector is positioned for a more active and competitive investment environment heading into 2026.
To frame today’s transaction trends from an investor’s perspective, we spoke with Doug Ressler, who leads Business Intelligence at our sister company, Yardi Matrix.
Doug Ressler, Business Intelligence Manager at Yardi Matrix 
What should investors expect from self storage performance in 2026?
The U.S. self storage sector is on track for measured, stable growth in 2026. Demand continues to be anchored by life events such as moving, downsizing, divorce, as well as ongoing business storage needs. Even after the post-pandemic surge cools, the fundamentals of the sector remain strong: rising housing costs keep external storage compelling, and roughly 60% of renters plan to keep units for over a year, signaling durable occupancy.
For investors evaluating acquisitions, the story is less about explosive rent spikes and more about predictable performance. Operators are shifting toward efficiency, long-term retention, and tech-enabled differentiation factors that will increasingly separate strong assets from average ones. Well-run facilities should continue delivering consistent returns even as margins face pressure from rising costs and heightened competition.
Methodology
This analysis was done by StorageCafe, an online platform that provides storage unit listings across the nation. The data on property sales, self storage prices and self storage inventory was taken from Yardi Matrix, StorageCafe’s sister division and a business development and asset management tool for brokers, sponsors, banks and equity sources underwriting investments in the multifamily, office, industrial and self storage sectors.
To identify the top cities by total sales volume and square footage, as well as the highest-value sales transactions, we analyzed all U.S. cities for which sales data was available.
Notes on data timeliness:
- Reporting Period: All figures and trends discussed in this report pertain specifically to Q3 2025 (July–September 2025).
- Extraction Date: Data was retrieved and analyzed in November 2025, ensuring inclusion of the most up-to-date and complete records for the quarter.
- Publication Date: The findings and interpretations are presented as of November 2025.
Due to the nature of real estate transactions, not all property sales have disclosed prices. For transactions where pricing information was available, we calculated the sale price per square foot by dividing the total reported sales price of those properties by their total square footage.
All figures related to facility size refer to total square footage rather than rentable square footage. While we have made every effort to ensure the accuracy of the data, figures are based on available records and may be subject to revisions or updates.
Fair use and distribution
This study serves as a resource for the general public on issues of common interest and should not be regarded as investment advice. The data is true to the best of our knowledge, but may change if amendments to it are made. We agree to the distribution of this content, but we do require a mention in return for attribution purposes.
Want to explore how this trend has developed over time? Check out our previous reports on self-storage sales.



Moving From a House to an Apartment: What to Expect, How to Downsize & How Self Storage Helps
For some, moving from a house to an apartment is a financial decision. For others, it’s about simplifying life. Maybe the kids have moved out and half the house sits empty, or you’re approaching retirement and no longer want to spend weekends on repairs. Or perhaps you’ve been weighing the cost of buying a home and wondering whether renting simply makes more sense right now.
Family Heirlooms Overload: How to Handle Family Inheritance Without Regret
Handling family heirlooms after a loss requires managing legal authority, emotional pressure and practical logistics at the same time, and the order you take them on matters more than most people expect.
Blanket Storage: The Right Method for Every Space and Season
Blankets make our lives cozier, and storing them well is what keeps them soft and comfortable in the long run. Knowing how to store a blanket properly means your favorites come out of storage smelling fresh, feeling the same as when they went in, and lasting years longer than they otherwise would.

Board Game Storage Ideas That Keep Your Collection in Fighting Shape
Nobody warns you that getting into board games usually unlocks a second hobby, the much dreaded one that includes figuring out where on earth to put them. One game becomes a few, expansions start spawning beside their base boxes and before long, board game storage requires as much strategy as whatever is waiting on the other side of those lids.
Storage Locker vs. Storage Unit: What’s the Difference?
A locker and a unit may sound like two names for the same four walls and a lock, and depending on the storage facility, you may even see the terms used that way. However, once you start comparing available spaces, storage lockers tend to occupy the smaller end of the spectrum, while storage units(opens in new tab) give you considerably more room to work with.
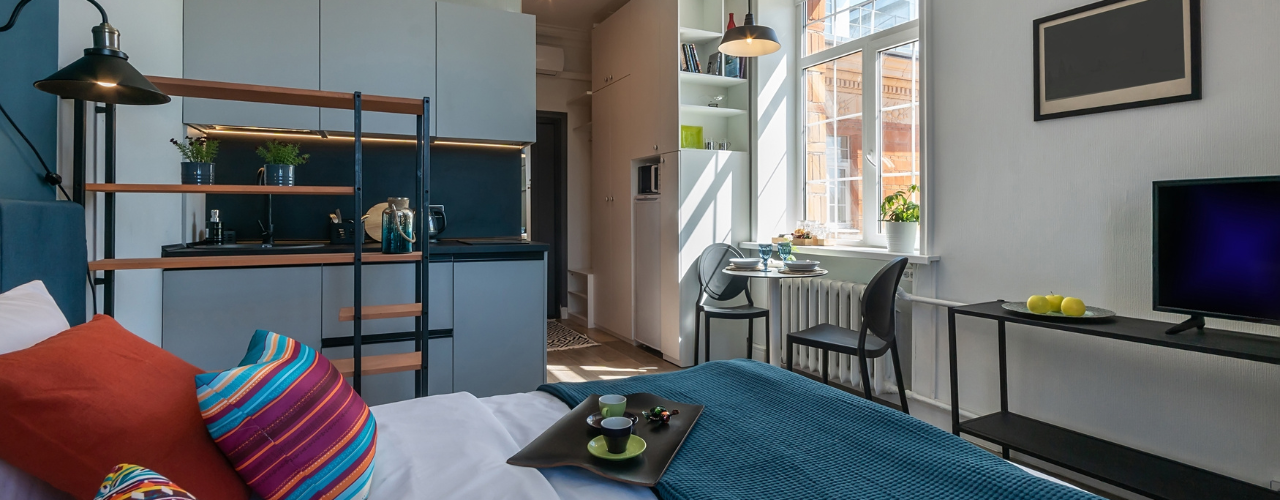
Storage Ideas for Small Spaces: 9 Ways to Max Out Your Home
A messy home contains the seeds of its organization. Those seeds are everywhere: the space above doors, under beds, behind sofas and inside furniture can all become storage. Here are the best storage ideas for small spaces, so you can make the most of your cozy home.

Best U.S. Cities to Live Uncluttered: Plano, TX, Offers the Most Room to Breathe
Clutter is in our homes as much as in our heads. Both are shaped by where we live.
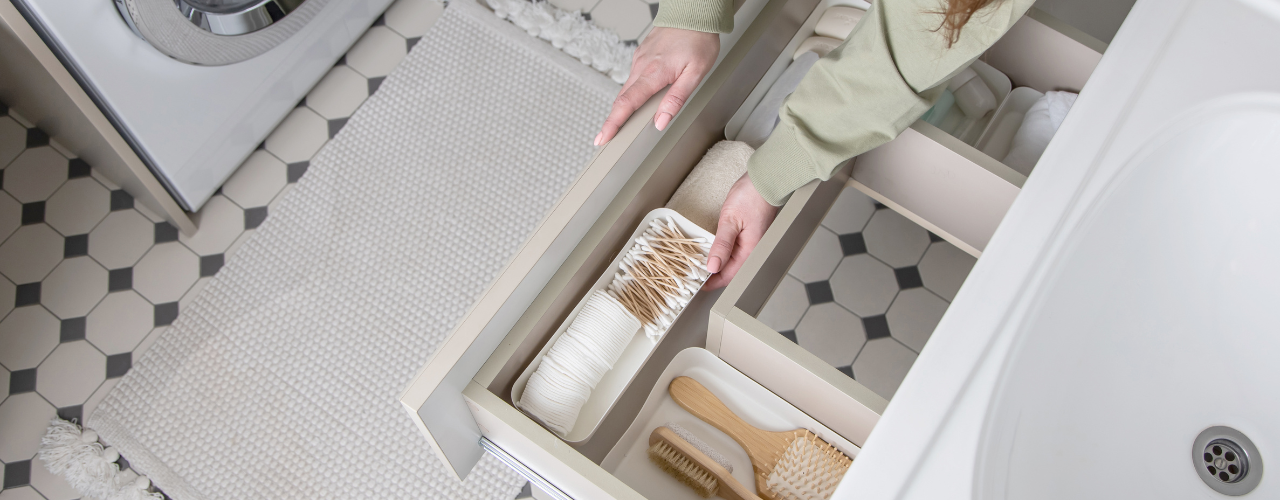
How to Organize Your Bathroom: 8 Ways to Stay Tidy
You already know why an organized bathroom is worth the effort, but let us remind you: it makes rushed mornings easier, keeps counters cleaner and just helps get you in the mood to go through your skincare routine like you should. Plus, in bigger households, it helps everyone find what they need. And you know how much a tidy bathroom counts for your self-esteem when a guest or a partner shows up. Luckily, you don’t need a degree to know how to organize your bathroom. The secret is keeping less, giving every item a home and making that home simple to use. Let’s go through some practical steps can help you create a bathroom that stays functional and nice to look at.

How to Use Silica Gel Packets for Storage
Moisture can cause significant damage to items in storage, leading to rust on tools, mold on clothing and warping in documents. Silica gel uses science to fix that. Often found in small packets inside product packaging, silica gel is a desiccant that absorbs moisture from the air, keeping your stored items dry and protected. This guide explains what silica gel is, how it works and how you can use it to preserve your belongings in self storage.