South Carolina Wins Over Gen Zers: Young Adults Lead Migration Wave To The Palmetto State

- In 2023, South Carolina welcomed 61,000 people in net migration, or about 166 new arrivals per day.
- Kershaw and Richland Counties, anchored by Camden and the Columbia metro area, stand out as the top destination for newcomers to South Carolina. Together, they welcomed more than 17,500 residents through net migration and also recorded the highest overall mobility, with 49,900 move-ins and 32,400 move-outs.
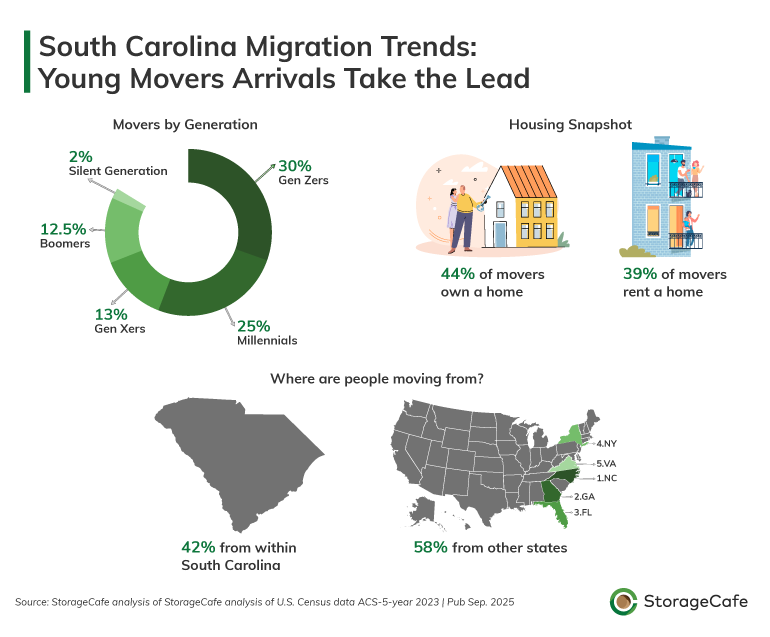
- Gen Z leads the migration wave into South Carolina, representing 30% of all new arrivals, followed closely by millennials at 25%.
- Baby boomers dominate only one major destination: the combined Dillon, Horry, and Marion Counties
- Most newcomers (44%) purchase homes within their first year, compared to 39% who rent. Dillon, Horry and Marion counties report the biggest shares of homeowners among relocators in major moving hotspots.
- Charleston County posted the largest renter population (52%) and attracted the highest percentage of remote workers (23%) and college-educated arrivals (46%) among the 10 top destinations.
- Home to the city of Lexington, Lexington County experienced the highest outmigration, shedding nearly 5,000 residents after accounting for move-ins.
South Carolina continues to shine as a relocation hotspot, ranking among the top five most popular states to move to, based on net migration numbers. In 2023, the state welcomed roughly 336,000 new residents while 270,000 left, resulting in a net gain of about 66,000 people. This translates to around 166 newcomers per day, according to our latest analysis of U.S. Census data.
Kershaw and Richland counties together stand out as South Carolina’s top destination for newcomers, welcoming more than 17,500 residents in net migration. This dynamic duo offers the best of both worlds: the vibrant pull of Columbia as the state capital and the suburban charm of nearby Richland. The combination is proving especially attractive to Gen Zers, who are moving here in larger numbers than any other age group.
This trend mirrors what’s happening statewide. Gen Z makes up 30% of all move-ins to South Carolina, making them the driving force behind the state’s growth. Millennials aren’t far behind, representing 25% of new arrivals, which underscores South Carolina’s strong appeal to younger generations overall.
When compared nationwide, South Carolina ranks as the second most popular destination for Gen Z migrants, even after factoring in those who leave the state.
What we’re seeing is fundamentally different from traditional retirement-driven migration to the South,” said Emilia Man, senior analyst at StorageCafe. “Gen Z and millennials are choosing South Carolina not just for lower costs, but for genuine economic opportunity combined with quality-of-life benefits that were previously only available in much more expensive markets.
By contrast, baby boomers make up just 12.5% of movers to South Carolina. They emerge as the leading cohort only in the combined Dillon–Horry–Marion counties, which together record the state’s second-highest net migration.
These generational differences in destination choices highlight how lifestyle priorities shape migration. Gen Z migrants are clustering around university towns and emerging tech centers where they can build careers, while millennials are gravitating toward suburban areas with good schools and family amenities. Baby boomers, meanwhile, are still following traditional patterns toward quieter, recreational communities, Man added.
Housing trends also reflect these shifts. More newcomers are buying homes than renting, with 44% of new arrivals becoming homeowners within their first year in the state, compared to 39% who rent. Dillon, Horry, and Marion counties collectively show the highest newcomer homeownership rate at 59%. Other counties with strong rates of homeownership among new residents include Clarendon, Georgetown, Williamsburg, and Spartanburg – each with more than half of arrivals purchasing homes in their first year.
At the county level, most new arrivals to South Carolina are coming from other states. Neighboring North Carolina is the top feeder state for 7 out of 10 of the counties with the highest net migration. Dillon, Horry, and Marion counties stand out, with 80% of their newcomers arriving from outside South Carolina.
The influence of major metro areas like Columbia, Charleston, and Augusta helps explain this trend. These hubs combine attractive career opportunities with a lower cost of living, making them powerful magnets for out-of-state movers. Man points to several key factors driving this trend.
The state has successfully diversified its economy beyond traditional industries, creating tech hubs in Columbia and Charleston, and a growing remote work ecosystem. When you combine that with housing costs that are below comparable markets in North Carolina or Georgia, it creates compelling value propositions for young professionals, she noted.
South Carolina counties with the highest net migration: Gen Z leads the way
As the main engine of net migration, Gen Z is chasing lower housing costs, stronger job growth, and vibrant communities that offer both careers and quality of life.
The state’s migration patterns reflect broader national trends toward suburban expansion and remote work flexibility. Counties outside major urban centers are experiencing the strongest growth, as newcomers seek affordable housing and improved work-life balance while maintaining access to metropolitan amenities.
Below is a breakdown of the counties posting the strongest net migration gains, highlighting where newcomers are choosing to settle and why these areas stand out in the state’s evolving migration landscape.
1. Kershaw and Richland Counties
Net move-ins: 17,531
Within South Carolina: 47%
Biggest demographic: Gen Z
Homeowner/renter ratio among move-ins: 25%/38%
Kershaw and Richland Counties, anchored by Columbia, hold the top spot for newcomers in South Carolina—and it’s not just about the numbers. Together, they brought in more than 17,000 new residents through net migration and nearly 50,000 total move-ins, making the capital region the busiest hub for relocations statewide.
Columbia itself drives much of the draw. As the state capital, it pairs a growing job market in tech and healthcare with the presence of the University of South Carolina, which fuels both steady employment and a lively cultural backdrop. Add to that a relatively low cost of living, and the region sets the stage for younger movers to put down roots.
Newcomers are finding that their dollars go further in South Carolina, where the average income of around $31,000 provides more breathing room than in higher-cost states. Many arrivals begin by renting—roughly 38% choose this path—but the region’s relatively affordable housing market continues to offer opportunities for homeownership over time.
Gen Z leads the wave of newcomers, but most arrivals aren’t crossing the entire country to get here—they’re often coming from nearby. North Carolina sends the largest share, followed by Georgia, with both groups drawn by the same promise: affordability combined with a metro economy that continues to gain momentum.
2. Dillon, Horry and Marion Counties
Net move-ins: 8,494
From SC: 19%
Biggest demographic: Baby boomers
Homeowner/renter ratio among move-ins: 59%/31%
With more than 8,000 newcomers in net migration, Dillon, Horry, and Marion counties together form South Carolina’s second most popular landing spot. What sets this trio apart is the age profile: It’s the only major destination where baby boomers lead the way, outpacing younger generations in their share of arrivals.
The Pee Dee’s suburban calm is a big part of the draw. Retirees seeking affordability and a quieter pace of life find it here, and many commit quickly. Nearly 6 in 10 newcomers buy a home within their first year—South Carolina’s highest newcomer homeownership rate—thanks to boomers’ financial footing and preference for ownership.
The math works in their favor. With average home prices around $242,000, the region looks like a bargain compared to feeder states. New York, the second-largest source of arrivals after North Carolina, offers a stark contrast: retirees selling high-priced properties there can stretch their dollars much further once they resettle in South Carolina.
Although many arrivals are in-state, this region claims the state’s widest reach, with 81% of newcomers hailing from beyond South Carolina. That out-of-state pull underscores the Pee Dee’s appeal as a retirement haven—affordable, peaceful, and financially practical.
3. Oconee and Pickens Counties
Net move-ins: 8,088
From SC: 51%
Biggest demographic: Gen Z
Homeowner/renter ratio among move-ins: 40%/34%
Tucked into Upstate South Carolina, these counties ride the wave of Greenville’s booming economy while offering a more affordable place to land. With average home prices around $216,000 and rents hovering near $900, the housing market stays within reach for young professionals earning about $33,000 a year.
It’s no surprise, then, that Gen Z makes up much of the influx. They’re drawn by the balance: career openings in fast-growing fields like tech and manufacturing paired with the cultural outlets and lifestyle perks that make early adulthood feel more settled. The region delivers both opportunity and affordability, a rare combination in today’s market.
The newcomers aren’t just local. North Carolina leads as the top feeder state, with Florida close behind. Both groups chase the same equation—lower costs alongside job markets on the rise—and increasingly find it in South Carolina’s Upstate.
4. Spartanburg County
Net move-ins: 5,859
From SC: 52%
Biggest demographic: Millennials
Homeowner/renter ratio among move-ins: 54%/38%
Set against the scenic backdrop of the Blue Ridge foothills, Spartanburg County welcomed nearly 6,000 newcomers, many of them drawn by a mix of lifestyle and opportunity. Anchored by major employers like BMW and Michelin, the county offers a path for young professionals to chase career growth without giving up livability, with millennials, in particular, making their mark here.
With average incomes around $42,000 and home prices near $216,000, new arrivals find buying within reach. In fact, Spartanburg posts the highest homeownership rate among millennial-heavy destinations, with more than half of new residents purchasing a home in their first year—a sign of a generation eager to put down roots.
The flow is largely coming from within South Carolina. As for out-of-state sources, North Carolina leads the way, sending close to 2,600 newcomers just across the border, while California follows with nearly 1,200. Together, they highlight Spartanburg’s growing role as a magnet for those seeking both affordable housing and strong job prospects.
5. Greenville County
Net move-ins: 3,994
From SC: 42%
Biggest demographic: Millennials
Homeowner/renter ratio among move-ins: 39%/51%
Greenville County, the anchor of the Greenville–Anderson metro, drew a steady stream of newcomers in 2023. Its mix of career prospects and cultural amenities makes it especially appealing to millennials intent on balancing work with lifestyle.
Those who settle here bring in an average annual income of about $51,000—roughly 22% higher than what newcomers earn in neighboring Spartanburg. That extra cushion helps balance Greenville’s higher housing costs, though most newcomers ease in as renters first, with 51% choosing to lease before making the leap to homeownership.
The county’s pull reaches well beyond South Carolina’s borders. North Carolina tops the list of feeder states, sending nearly 3,000 movers, while Georgia adds close to 2,000 more. What keeps them coming is clear: a business-friendly environment fueled by major employers like BMW, Michelin, and GE, paired with the kind of lifestyle that convinces people to stay.
6. Charleston County
Net move-ins: 3,514
From SC: 31%
Biggest demographic: Gen Z
Homeowner/renter ratio among move-ins: 34%/52%
Over on the coast, Charleston County also excels at attracting newcomers to the tune of 3,500+. Charleston proper is the main draw of the area, balancing excellent career opportunities with affordable living against the backdrop of coastal lifestyle peppered with a rich cultural and artistic scene. It’s no surprise to see that Gen Zers are the main age group heading here.
At $450,000, homes average almost double what they cost in other moving hotspots such as Kershaw and Richland counties and Spartanburg. However, incomes are also much higher at almost $61,000 annually, with opportunities in tech, aerospace engineering ensuring access to high-paying jobs. Naturally, with a strong white collar job market, remote workers abound, standing at 23%. That’s the highest share of teleworkers among the top 10 destinations in South Carolina, more than double the state’s average.
7. Berkeley County
Net move-ins: 2,792
From SC: 34%
Biggest demographic: Gen Z
Homeowner/renter ratio among move-ins: 37%/49%
Berkeley County, which includes Goose Creek and parts of greater Charleston, added nearly 2,800 new residents through net migration. For Gen Z, it offers a middle ground: close enough to Charleston’s job market and cultural scene to enjoy the perks, but with housing that’s far more within reach.
Homes here average about $280,000—roughly $170,000 less than in Charleston proper. That price gap gives younger professionals the chance to buy early while still tapping into Charleston’s thriving industries, from tech and aerospace to health care.
Most newcomers are arriving from outside South Carolina, making up about two-thirds of the inflow. North Carolina leads the pack, but Virginia, Florida, and California also send their share. Many start out renting—49% choose that path—but as their careers take off, a growing number make the move into ownership.
8. Clarendon, Georgetown and Williamsburg Counties
Net move-ins: 2,788
From SC: 49%
Biggest demographic: Millennials
Homeowner/renter ratio among move-ins: 55%/28%
Waterfront living, combined with outdoor recreation golfing, fishing and other opportunities to enjoy local amenities in a suburban setting are part of the reasons why millennials are moving here predominantly.
Proximity to Myrtle Beach adds to this destination’s appeal, while housing costs remain relatively low. In fact, the area features some of South Carolina’s most affordable housing in the top 10, with homes averaging $199,000. Paired with newcomer incomes of around $48,000, this has pushed homeownership rates to 55% in the first year.
The region draws roughly equal numbers from in-state and out-of-state sources, indicating broad appeal across South Carolina and neighboring states.
9. Allendale, Bamberg, Beaufort, Colleton, Jasper and Hampton Counties
Net move-ins: 2,601
From SC: 25%
Biggest demographic: Gen Z
Homeowner/renter ratio among move-ins: 49%/32%
In Lowcountry, Allendale, Bamberg, Beaufort, Colleton, Jasper and Hampton collectively charmed Gen Zers – the main generation moving here – in search of new opportunities combined with beautiful scenery. Strategic location between major metropolitan areas like Columbia, Augusta, and Charleston offers job access while preserving small-town character.
Fresh arrivals are outearning every top 10 destination in South Carolina, bringing home close to $63,000 annually. Consequently, they’re buying homes at the highest rate among top destinations, with close to half of them becoming homeowners within the first year of moving.
Collectively, these counties represent the only other moving destination where out-of-staters are primarily coming from a state other than North Carolina, namely Georgia, followed by Florida.
10. Laurens, Newberry and Union Counties
Net move-ins: 2,236
From SC: 56%
Biggest demographic: Millennials
Homeowner/renter ratio among move-ins: 48%/32%
The suburban quiet life of these counties with close proximity to the Greenville and Spartanburg metro areas mostly attracts millennials to this migration hotspot. The appeal seems to derive from the attractive home prices of around $143,000 – the lowest among the major relocation destinations in the state. This is making most newcomers jump on the homeownership bandwagon, even as rents are as low as $830/month.
This is one of the few top 10 destinations where most newcomers are coming from South Carolina, at a 56% rate. As for out-of-state migration, North Carolina, Florida and Hawaii are the origin states. With many move-ins in their 30s, this South Carolina destination presents as an affordable place to put down roots and buy a home.
South Carolina counties losing most residents
Even as much of South Carolina continues to attract newcomers, a few areas are experiencing the reverse trend. In 2023, Lexington and Florence counties posted notable net migration declines, pointing to economic challenges and changing preferences among residents.
Lexington County
Lexington County saw the most significant population decline in the state, with roughly 5,000 people leaving. Several factors may be contributing to why some residents choose to leave. As demand has driven up housing demand, affordable homes are scarcer for middle and low-income residents. Rising housing demand has made affordability harder for middle- and lower-income households, while flood risk, limited amenities, hot summers, and ongoing traffic concerns add to the outflow.
Despite the overall outgoing flow, Lexington is still attracting a large number of newcomers, to the tune of 16,000 and most of them are millennials coming from out of state. North Carolina and New York were the main suppliers of new arrivals for this county.
Florence County
With an unemployment of 5.2%, which is over the 4% of the state’s average, Florence County is seeing close to 1,800 of its residents moving away in net migration numbers. Fewer employment opportunities are behind this trend. However, a good 5,000 Americans made Florence their home in 2023, with millennials in the lead. Most movers came from South Carolina, but outside of the state, new residents hailed from Alabama, North Carolina and Idaho.
High self storage inventories help support local residents in South Carolina’s migration hotspots
With South Carolina being one of the top population-gaining states, the need for extra space tends to rise as new residents move in and households expand. Self storage fills the gap, giving residents a flexible solution for managing possessions during relocations, home projects, or lifestyle shifts. To match the surge in demand, developers have amped up construction in more than half of the state’s cities with populations over 10K residents from 2020 to 2025, delivering about 5.8M square feet in total across the state during this period.
Self Storage Inventory Changes Across South Carolina’s Cities (2020-2025)
| Rank | City | County | 2025 Total Self Storage Inventory | Self Storage Inventory Change (%)* | Self Storage Inventory change (sq. Ft)* | Sq. Ft./Capita | Self Storage Rent ($) |
|---|---|---|---|---|---|---|---|
| 1 | Columbia, SC | Richland | 3,740,990 | 13% | 483,322 | 8.68 | $109 |
| 2 | Greenville, SC | Greenville | 2,987,683 | 3% | 91,000 | 9.12 | $114 |
| 3 | Myrtle Beach, SC | Horry | 2,254,223 | 17% | 394,219 | 11.71 | $127 |
| 4 | Charleston, SC | Charleston | 1,844,202 | 13% | 232,456 | 6.22 | $163 |
| 5 | Summerville, SC | Dorchester | 1,843,000 | 17% | 304,435 | 9.43 | $131 |
| 6 | Spartanburg, SC | Spartanburg | 1,420,197 | 31% | 444,103 | 10.03 | $96 |
| 7 | Rock Hill, SC | York | 1,414,191 | 19% | 267,083 | 11.6 | $109 |
| 8 | Mount Pleasant, SC | Charleston | 1,225,821 | 10% | 118,765 | 10.86 | $152 |
| 9 | Anderson, SC | Anderson | 1,179,605 | 5% | 56,525 | 11.52 | $101 |
| 10 | Fort Mill, SC | York | 1,149,836 | 20% | 230,801 | 6.53 | $146 |
| 11 | Lexington, SC | Lexington | 977,564 | 23% | 229,158 | 7.01 | $117 |
| 12 | Florence, SC | Florence | 953,071 | 47% | 447,003 | 11.05 | $100 |
| 13 | North Charleston, SC | Charleston | 933,815 | 0% | 0 | 4.11 | $129 |
| 14 | Aiken, SC | Aiken | 801,580 | 31% | 246,468 | 12.48 | $106 |
| 15 | Simpsonville, SC | Greenville | 774,428 | 13% | 103,482 | 5.98 | $120 |
| 16 | Greenwood, SC | Greenwood | 761,560 | 0% | 0 | 17.06 | $113 |
| 17 | Conway, SC | Horry | 704,604 | 45% | 319,705 | 10 | $113 |
| 18 | Little River, SC | Horry | 639,729 | 13% | 86,250 | 14.63 | $116 |
| 19 | Beaufort, SC | Beaufort | 573,193 | 15% | 84,003 | 14.75 | $125 |
| 20 | Bluffton, SC | Beaufort | 565,652 | 4% | 24,062 | 9.73 | $143 |
| 21 | Sumter, SC | Sumter | 565,644 | 6% | 32,723 | 7.77 | $142 |
| 22 | Goose Creek, SC | Berkeley | 560,500 | 0% | 0 | 5.24 | $130 |
| 23 | Greer, SC | Greenville | 515,951 | 10% | 53,000 | 3.63 | $119 |
| 24 | West Columbia, SC | Lexington | 477,862 | 20% | 95,934 | 4.5 | $118 |
| 25 | Murrells Inlet, SC | Georgetown | 452,939 | 13% | 60,135 | 9.47 | $102 |
| 26 | Hilton Head Island, SC | Beaufort | 430,223 | 0% | 0 | 11.95 | $166 |
| 27 | Orangeburg, SC | Orangeburg | 326,537 | 0% | 0 | 10.04 | $142 |
| 28 | Irmo, SC | Richland | 326,409 | 16% | 53,312 | 4.41 | $112 |
| 29 | Moncks Corner, SC | Berkeley | 316,509 | 0% | 0 | 6.88 | $121 |
| 30 | Easley, SC | Pickens | 300,083 | 45% | 133,924 | 6.19 | $111 |
| 31 | Boiling Springs, SC | Spartanburg | 290,774 | 0% | 0 | 5.85 | $113 |
| 32 | Lake Wylie, SC | York | 290,070 | 0% | 0 | 8.98 | $142 |
| 33 | Taylors, SC | Greenville | 265,477 | 0% | 0 | 4.03 | $113 |
| 34 | North Augusta, SC | Aiken | 239,988 | 36% | 85,230 | 5.23 | $108 |
| 35 | Ladson, SC | Berkeley | 239,040 | 0% | 0 | 2.71 | $112 |
| 36 | Gaffney, SC | Cherokee | 229,454 | 0% | 0 | 10.4 | $50 |
| 37 | Wando, SC | Charleston | 89,257 | 0% | 0 | 7.59 | $158 |
| 38 | Cayce, SC | Lexington | 84,295 | 0% | 0 | 1.61 | $104 |
| 39 | Mauldin, SC | Greenville | 80,668 | 0% | 0 | 1.82 | $95 |
| 40 | North Myrtle Beach, SC | Horry | 76,866 | 0% | 0 | 3.58 | $143 |
| 41 | Port Royal, SC | Beaufort | 67,360 | 0% | 0 | 3.99 | $113 |
| 42 | Newberry, SC | Newberry | 63,417 | 0% | 0 | 4.51 | $82 |
| 43 | Hanahan, SC | Berkeley | 55,364 | 0% | 0 | 1.28 | $127 |
| 44 | Garden City, SC | Horry | 49,248 | 0% | 0 | 1.46 | $108 |
| 45 | Daniel Island, SC | Berkeley | 34,000 | 0% | 0 | 3.28 | $147 |
| 46 | Okatie, SC | Beaufort | 30,447 | 0% | 0 | 6.23 | No data |
Source: StorageCafe analysis of data from Yardi Matrix | Pub. Sept 2025
Columbia, SC, which was among the top destinations for net migration in 2023 also leads in self storage availability boasting over 3,740,000 square feet of self storage space in total inventory. This translates to about 8.7 square feet of self storage space per capita. This balanced supply results in a renter-friendly market, with rates currently standing at $109/month.
Greenville, another high-migration destination is also well-equipped to serve its residents thanks to the nearly 3M square feet of self storage space available in the city, equating to over 9 square feet per capita and monthly rates of about $114/month. In third place is Myrtle Beach, ranked as the second-best county-level migration destination, with over 2.2M square feet of total inventory, 17% of which was built in the last five years. Now, the city has a healthy 11.7 square feet per resident. A Myrtle Beach unit rents for about $127/month.
Similarly, in other migration hotspots such as Charleston and Spartanburg, self storage inventories exceed 1M square feet, providing plenty of extra space to existing and new residents who now call these cities home.
South Carolina’s migration evolution paints a picture of a state in transition, shaped by the unique priorities of each generation. The younger generations are leading the charge, gravitating toward affordable housing, promising job markets, family-friendly settings and vibrant communities, especially in destinations like Kershaw, Richland, and Greenville counties.
At the same time, counties like Lexington and Florence are facing population losses, underscoring that migration is as much about what residents leave behind as it is about where they choose to go.
Methodology
This analysis was conducted by StorageCafe, an online platform that offers nationwide storage unit listings.
For the purposes of this report, we created a ranking of net migration numbers in South Carolina by subtracting the number of residents leaving the state from the total number of move-ins by location.
Stats on migration, income, homeownership, educational attainment and remote work came from the U.S. Census American Community Survey PUMS 5-Year, 2023. The survey uses PUMAs (Public Use Microdata Areas) to refer to geographic areas with over 100k residents that can cover one or more counties and were used as geographic units to define migration trends and demographics associated with the trend.
Median home prices were sourced from 2023 owner-occupied housing unit values coming from the U.S. Census (ACS 5-Year). For data on rents, we turned to 2023 U.S. Census American Community Survey (ACS 5-Year).
For data on unemployment, we turned to the Bureau of Labor Statistics (July 2025 data set).
The self storage data for this analysis comes from Yardi Matrix, StorageCafe’s sister division, which offers a business development and asset management tool used by brokers, sponsors, banks, and equity sources for underwriting investments in the multifamily, office, industrial, and self-storage sectors.
Fair use and distribution
This study serves as a resource for the general public on issues of common interest and should not be regarded as investment advice. The data is true to the best of our knowledge but may change if amendments to it are made. We agree to the distribution of this content, but we do require a mention in return for attribution purposes.


")
How to Store a Boat in Self Storage: Types, Costs & What to Look For
Storing a boat in self storage comes down to four decisions: how far the facility is from your launch point, what type of storage suits your climate (outdoor, covered, or indoor), how to prepare the boat before storing it, and whether the facility’s security and access hours fit how you use your boat. First-time owners who think through these factors before signing a lease tend to get significantly more use out of their boat.

Best RV Destinations in the U.S. (2026): Oceanfront Drives Beat America’s Usual RV Favorites
A new kind of traveler is reshaping the RV campground: younger, plugged in and rarely fully off the clock.

Temporary Storage During Emergencies: What to Know Before You Need It
When a hurricane’s bearing down, a wildfire is closing in, or floodwater has already reached your front door, the last thing you want to be doing is figuring out where to put your stuff – but that’s exactly when people find themselves scrambling for temporary storage.

Before You Store Your Car in Self Storage: What Documents You Actually Need
Most self storage facilities require four main things before allowing a vehicle onto the property: a valid photo ID, current vehicle registration, proof of insurance, and a signed rental agreement. Requirements beyond these vary by facility and state, particularly around insurance levels, registration status and whether the vehicle is financed

A Smarter Way to Start Your Storage Search: Inside the StorageCafe Resource Center
Renting a storage unit usually begins with a practical need. You may be preparing for a move, clearing space at home, renovating, downsizing or simply trying to bring more order into a crowded living situation. In many cases, the first instinct is to consider renting immediately.

Where to Donate Furniture in NYC (With Free Pick-Up Options)
Finding somewhere to donate furniture in NYC is more complicated than it should be. Not every organization accepts large items, pick-up availability is inconsistent, and the options that do exist aren’t always easy to find in one place. If you’re specifically hoping to donate furniture with free pick-up, the list of options gets even shorter.

Clean Out, Give Back: Where to Donate Clothes in Los Angeles
Few cities reinvent themselves like Los Angeles, and wardrobes tend to follow suit. Between changing seasons, evolving trends and an endless calendar of occasions worth dressing for, closets fill up fast, making the question of where to donate clothes in Los Angeles one that most Angelenos eventually find themselves asking.

How to Store Shoes Based on Your Personality
Your shoe closet is lying — not about how many pairs you own (that number is likely higher than you’d admit), but about who you are. The way you approach shoe storage, or avoid it, is one of the more honest reflections of your personality that exists in a home.

Tiny Home Storage Ideas for Every Nook and Cranny
Tiny home storage is one of those challenges that sounds straightforward until you’re standing in 200 square feet wondering where the winter coats are supposed to go. You didn’t downsize for the storage anxiety — you did it for the coziest place you’ve ever called home, a wallet that finally feels lighter, and a minimalist lifestyle that suits you just fine.