
2026 Self Storage Supply Report: Florida Leads A Strong National Expansion


Key Takeaways
- New supply projected to go online in 2026 totals 55.4 million square feet nationwide, representing 2.6% of the existing self storage inventory.
- Supply growth is concentrated in the South and West, led by Florida, Texas and California.
- At the metro level, 15 markets surpass 1 million square feet of projected self storage deliveries this year, led by New York and Phoenix, each adding nearly 3 million square feet.
- Large metros are expanding without major oversupply disruption, with most adding just 2–5% new inventory despite million-square-foot delivery volumes.
- Zooming in on the fastest-growing markets, Lumberton, NC, saw the biggest change, with its local inventory receiving a nearly 58% boost in storage space.
- New supply is making a dent in prices. In Sun Belt metros where inventory exceeds 10 square feet per capita — including Houston, San Antonio and Jacksonville — rent declines are nearly universal. The contrast is sharpest in supply-constrained coastal cities like New York (4.05 sq. ft. per capita), Boston (5.05) and Los Angeles (5.1), where new inventory is absorbed as fast as it arrives, leaving rents flat or still edging upward.
- Among the top 10 metros for new deliveries, rents are falling or flat in nine — the sole exception being New York, where rents are still edging up as 3.2 million new square feet of space barely registers against decades of unmet demand.
Self storage development is stepping down from its boom-era highs and settling into a more deliberate rhythm. Roughly 55.4 million square feet of new space is expected to come online in 2026, closely mirroring 2025 and signaling a market that is no longer sprinting, but still far from standing still.
This shift follows the late-2010s construction surge, when annual deliveries blasted past 70 million square feet in both 2018 and 2019. Development activity remained elevated through much of the pandemic before easing into today’s more moderate expansion cycle. At roughly 2.6% of the nation’s 2.12 billion square feet of inventory, projected 2026 growth remains meaningful, though still below the highs recorded earlier in the decade.
The growth map still tilts heavily South. Florida and Texas lead the country in projected deliveries, and 14 of the top 20 metros by new supply are located in Southern states. Together, Southern metros account for more than half of all 2026 national deliveries. Florida stands out most of all, with seven metros ranking among the top 20, a level of concentration that signals continued confidence in the state’s long-term demand.
At the same time, traditionally undersupplied coastal markets are finally adding scale. California is bringing 5.2 million square feet online this year, expanding its inventory by about 2%. New York — still one of the most storage-constrained states in the country, with under four square feet per capita — is set to grow inventory by roughly 4%. New York, alongside Virginia, are the only top 10 delivery states where street rents are still edging upward. In most other markets, pricing is easing as operators work through the heavy construction launched during peak migration years and adjust to slower interstate moves.
State leaders: Where 2026 supply is being built
Southern states account for the majority of 2026 deliveries, though the geographic picture is broadening, with traditionally undersupplied New York and New Jersey ranking among the top 10 states, each with a rather significant 4% expansion of their respective inventories.
Florida
- Emerges as 2026’s main construction engine, far outpacing other states
No state approaches Florida’s scale of development in 2026. With 10.3 million square feet projected to deliver this year, the state is expanding its inventory by 6%, effectively adding the equivalent of an entirely new mid-sized market every few months.
Demand fundamentals remain solid, though no longer accelerating at pandemic-era levels. Net in-migration continues to underpin storage needs, with roughly 68,000 new residents added in 2024, a meaningful inflow even as migration moderates from prior peaks. The state’s large retiree population contributes additional demand through downsizing, seasonal residency and second-home ownership. Meanwhile, Florida’s housing market, marked by relatively frequent moves, investor activity and short transaction cycles, tends to generate recurring storage usage.
At nearly 10 square feet per capita, Florida is already one of the better-supplied states nationally. Average asking rents hover around $137 per month, slightly above the $133 national benchmark. However, pricing momentum has softened. Statewide rents declined 2.8% year over year, and several Gulf Coast markets are experiencing some of the steepest corrections in the country.
Texas
- Adds new inventory at roughly half the pace of Florida
Texas delivered 6.9 million square feet in 2026, representing 3% inventory growth across a state that already holds more than 271 million square feet of storage space. In Houston and Dallas–Fort Worth, both with inventory bases exceeding 80 million square feet, annual additions of up to 2 million square feet are meaningful but manageable.
The state is better supplied than Florida, with roughly 11.5 square feet per capita, and average street rents are lower at around $115 per month. Pricing pressure has also been more contained. Rents declined 1.7% year over year, a smaller drop than Florida’s 2.8%.
The difference is largely structural. Texas growth is spread across deep, high-volume metros with stronger absorption capacity, while Florida’s supply is more concentrated and, in several smaller markets, represents double-digit inventory jumps. Scale and diversification are cushioning Texas from sharper rent corrections.
California
- Undersupply keeps a firm floor under pricing
California’s 5.1 million square feet amounts to a 2% inventory increase, with the state’s per-capita availability of 6.7 square feet still below the 7.4 national average. The structural constraint is straightforward: entitlement timelines in major California metros are among the longest in the country, and the cost of land in Los Angeles, the Bay Area, and San Diego makes ground-up development a high-stakes proposition that filters out marginal projects.
Beyond the Los Angeles metro area, where 1.8 million square feet, or nearly 3% of existing inventory, is expected to come online this year, new construction is broadly distributed across the state. Riverside–San Bernardino–Ontario is set to add 728,000 square feet, while Sacramento–Roseville–Folsom has 481,000 square feet in the pipeline, each representing roughly a 2% expansion of local inventory. Overall, less than half of California’s 2026 deliveries are concentrated in its three largest construction markets, signaling a geographically diversified development pattern.
Street rates across California metros run at $178/month — 34% above the national figure — and they are declining by less than 1% annually, a soft landing compared to the Sun Belt.
Georgia
- Savannah stands out as a fast-growing construction hotspot
Georgia‘s 2.6 million square foot planned deliveries are mostly concentrated in Atlanta and Savannah. Atlanta’s 1.38 million square feet, a 2.5% inventory increase, is a continuation of the metro’s long-running role as a logistics and corporate relocation hub, where steady household turnover across a sprawling metro footprint keeps occupancy durable.
Savannah is projected to see 17.5% inventory growth, with 652,000 square feet of new self storage space scheduled for delivery this year. Port activity, a growing industrial base, and a population profile that blends long-term residents with a seasonal and transient layer have made Savannah one of the most actively watched secondary markets in the Southeast for storage investors.
North Carolina
- Growth spreads alongside an expanding employment base
North Carolina plans 1.7 million square feet in deliveries 2026, reflecting a state whose economic geography has broadened significantly. Charlotte and the Research Triangle continue to anchor demand, but meaningful construction activity is now spread across secondary markets such as Greensboro, capturing residential and industrial spillover from larger neighbors.
The state’s per-capita availability of 10.2 square feet signals a well-served market overall, which means future growth is increasingly a function of location precision. Operators seemed focused on identifying the specific corridors where household formation is running ahead of storage supply, as construction activity is widely spread across the state and not concentrated in just a couple of major urban areas.
Northeast markets
- Persistent undersupply begins to attract new development
New self storage development in New York and New Jersey is arriving into a genuine structural deficit. New York is expanding its self storage inventory by roughly 4% this year, a meaningful step for a state that offers under four square feet per capita, well below the 7.4 national average. Street rents are still edging upward, one of only two top 10 delivery states where that is the case, reflecting how much room demand has to absorb new supply before pricing softens.
New Jersey presents a similar picture. Per-capita availability remains among the lowest in the country, and new facilities entering the market face a demand base that has historically outpaced available space. That underlying tightness is keeping rents stable even as inventory grows, a dynamic that sets both states apart from the Sun Belt markets where new supply is landing in already well-served conditions.
Connecticut‘s 1.1 million square feet of projected 2026 deliveries — a 6% inventory expansion — is another outlier among Northeastern states. In a dense, historically undersupplied market, that level of new supply represents a meaningful shift worth monitoring.
Top 10 metros for self storage deliveries in 2026
Self storage development remains active in 2026, but new supply is coming online at a measured pace — a sign that the industry is expanding without tipping into oversupply. Across the nation’s top delivery metros, new construction typically adds between 2% and 7% to existing inventory, underscoring steady confidence in long-term demand.
For renters, that continued expansion is already having an impact. In several high-growth Sun Belt markets, rising supply is starting to put downward pressure on prices, giving consumers more options and greater negotiating power.
The most supply-saturated markets in the top 10 are also where pricing pressure is most visible. Houston (1.99 million square feet, 11.49 sq. ft. per capita) is down 3.3% to $116 per month. Dallas–Fort Worth (1.66 million square feet, 10.87 sq. ft. per capita) is down 0.9% to $114 per month. Cape Coral–Fort Myers, thirteenth nationally in volume but carrying one of the heaviest proportional loads at 12% inventory growth, has seen rates fall 5.8% to $129 per month.
The New York City metro area leads the country in absolute square footage, with 3.2 million square feet scheduled for delivery in 2026, equal to 4.2% of existing inventory. Yet even with this expansion, New York-Newark-New Jersey remains the most undersupplied market among the top 20, offering just about four square feet of storage per capita, well below national norms. It is also the only metro area in top 10 for deliveries where street rents are still increasing, albeit modestly at 0.6% year over year. That pricing resilience proves how constrained the market remains despite rising development activity.
Phoenix–Mesa–Chandler ranks second nationally, with 2.9 million square feet expected to deliver by year-end. Unlike New York, Phoenix’s pipeline represents a more aggressive 7% expansion of local inventory, one of the highest proportional increases among major metros. The scale of construction reflects the metro’s sustained population growth and long-term migration inflows, though it also places Phoenix among the markets most exposed to short-term absorption pressures as demand normalizes.
Miami–Fort Lauderdale–West Palm Beach follows with 2.1 million square feet underway, equivalent to 4.7% of existing supply. While Miami is comparatively better supplied than many coastal peers, pricing remains elevated. Average street rents hover around $167 per month, well above the $133 national average. The persistence of higher rates suggests that demand drivers, including dense urban living patterns and limited in-home storage, continue to support pricing even as new facilities enter the market.
Among the most notable markets in the top 10 by new supply is also Los Angeles-Long Beach-Anaheim, ranking fifth nationally, with 1.8 million square feet projected for delivery in 2026. In a market long constrained by land scarcity and entitlement hurdles, new development represents incremental relief rather than oversupply risk. Los Angeles also commands the highest street rents among the top 20 metros for self storage deliveries, exceeding $200 per month, reinforcing the depth of unmet demand that has historically characterized the region.
Metros with the biggest self storage expansions: Lumberton, NC takes the lead
Current self storage development also reflects how self storage demand has spread well beyond dense urban cores. What was once closely tied to small-apartment living and urban flexibility has increasingly moved into feeder markets, suburban corridors and smaller regional hubs, areas where population growth, household formation and lifestyle shifts are creating steady need for extra space.
In percentage terms, some of the most significant shifts are happening in these smaller markets. Lumberton, NC claims the top spot with a 58.2% inventory increase — approximately 181,000 square feet to be added to the local inventory. The market serves not only Lumberton’s residents but a broader surrounding area of southeastern North Carolina, where recent manufacturing and healthcare investments are creating a positive outlook for household formation. Roanoke Rapids followed at 36.6%, another North Carolina market where economic reinvestment also stimulates self storage demand.
Further down the list, Savannah’s 17.5% expansion reflects operator interest in a port-adjacent growth market. A cluster of Florida metros at 10–14% inventory expansion — Palm Bay, Lakeland, Cape Coral, North Port-Sarasota — represents a different calculation: proportionally large volumes arriving into markets with existing healthy supply reflect Florida’s typical demand drivers, from retirees to snowbirds.
The 2026 pipeline, taken as a whole, reflects an industry that has recalibrated since the pandemic-era surge. Growth is real, but it is measured — concentrated in markets with durable demand drivers and managed at proportions that preserve the fundamentals operators and renters alike depend on.
Methodology
This analysis was conducted by StorageCafe, an online platform that offers nationwide storage unit listings.
This analysis examines 190 U.S. metropolitan areas based on the volume of self storage space under construction and already delivered in 2026. Markets were ranked and compared according to total new supply to be added by current year’s end, to provide a consistent basis for identifying where construction activity is most concentrated.
We also included total existing inventory for each metro up to the end of 2025 along with the average street rates.
In addition, we calculated 2026’s projected new supply as percentage of total inventory on a national, state and metro-level, to measure the relative speed of construction at each market level.
Data on self storage street rates and construction data came from our sister division Yardi Matrix, a business development and asset management tool for brokers, sponsors, banks and equity sources underwriting investments in the multifamily, office, industrial and self storage sectors.
Fair use and distribution
This study is intended as a resource for the general public on topics of common interest and should not be considered investment advice. The data presented is accurate to the best of our knowledge, based on thorough and good-faith research, but it may change due to external factors.
We permit the distribution of this content, provided that proper attribution is given to “StorageCafe” with a link back to the research study.

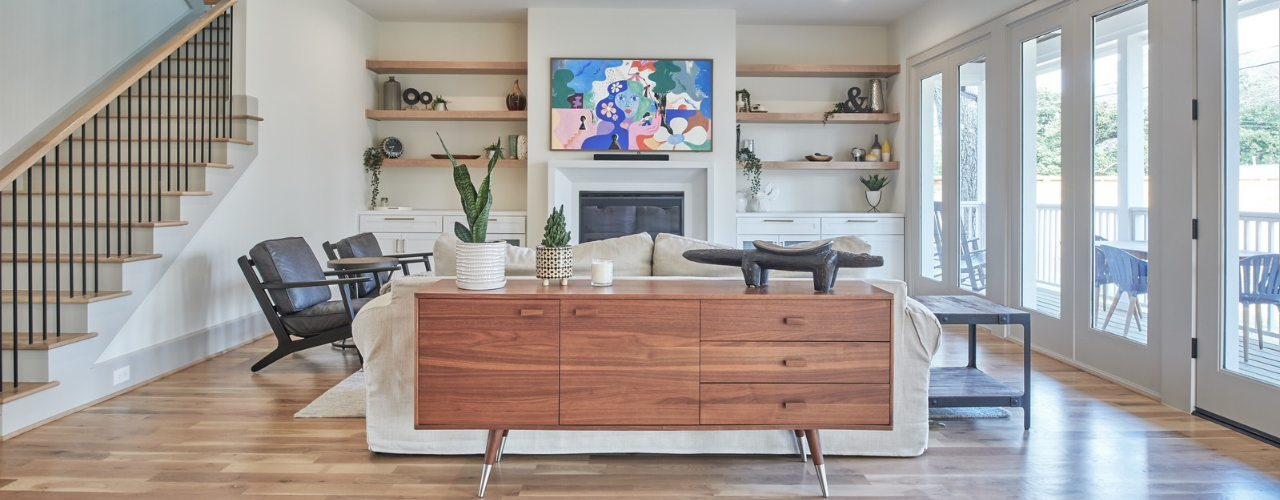
Living Room Storage Ideas: 28 Ways to Reclaim Your Hosting Space
If a living room is where most of a household’s living happens, good storage should be the top priority for setting up or revamping the place. After all, think of how easier it would be to have people over when tidying up the place is just a matter of putting things in their right place (in a time when fewer and fewer people are entertaining friends at home(opens in new tab)). The trick is making room for all those wayward clothes, blankets, chargers and other small things that end up on (or, inexplicably, in) the sofa. Here are 28 living room storage ideas to get you started and make tidying up a quick affair.
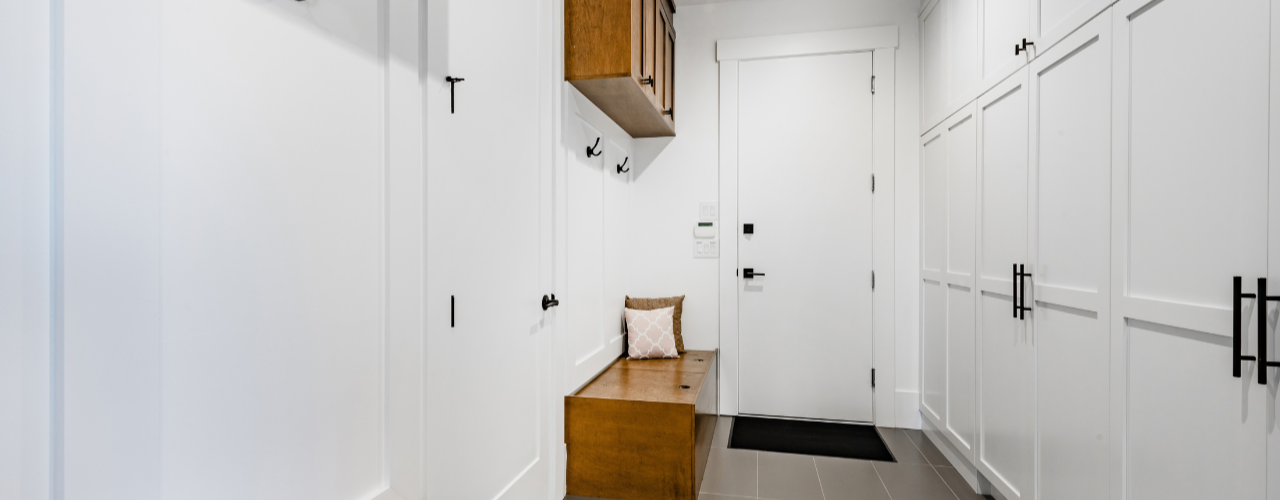
25 Mudroom Storage Ideas (And Mistakes to Avoid)
When you come home with muddy boots, an armful of bags and a coat you can’t wait to take off, it’s nice to have somewhere to put it all. With a mudroom, you can leave the outdoor mess at the door instead of carrying it through the house. Traditionally, you’d set aside a separate room, but you can just as easily use a hallway, an entryway closet, a laundry-room corner or a stretch of wall near the entrance.
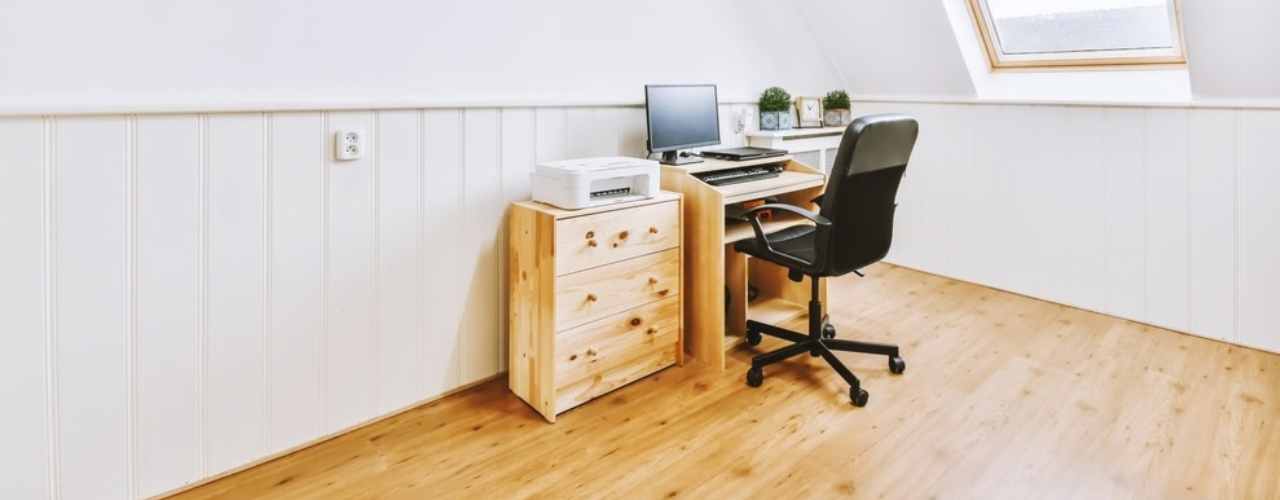
Is Your Home Office Worth the Rent? What Coworking and Self Storage Could Save You
Every square foot of your apartment comes with a price tag, and a home office claims more of them than most renters expect. It starts with a desk. Then come the second monitor, the printer, the filing cabinet and the overflow boxes. Before long, the corner you set aside for work has turned into a small room you are paying for every month.

Best U.S. Cities to Live Uncluttered: Plano, TX, Offers the Most Room to Breathe
Clutter is in our homes as much as in our heads. Both are shaped by where we live.
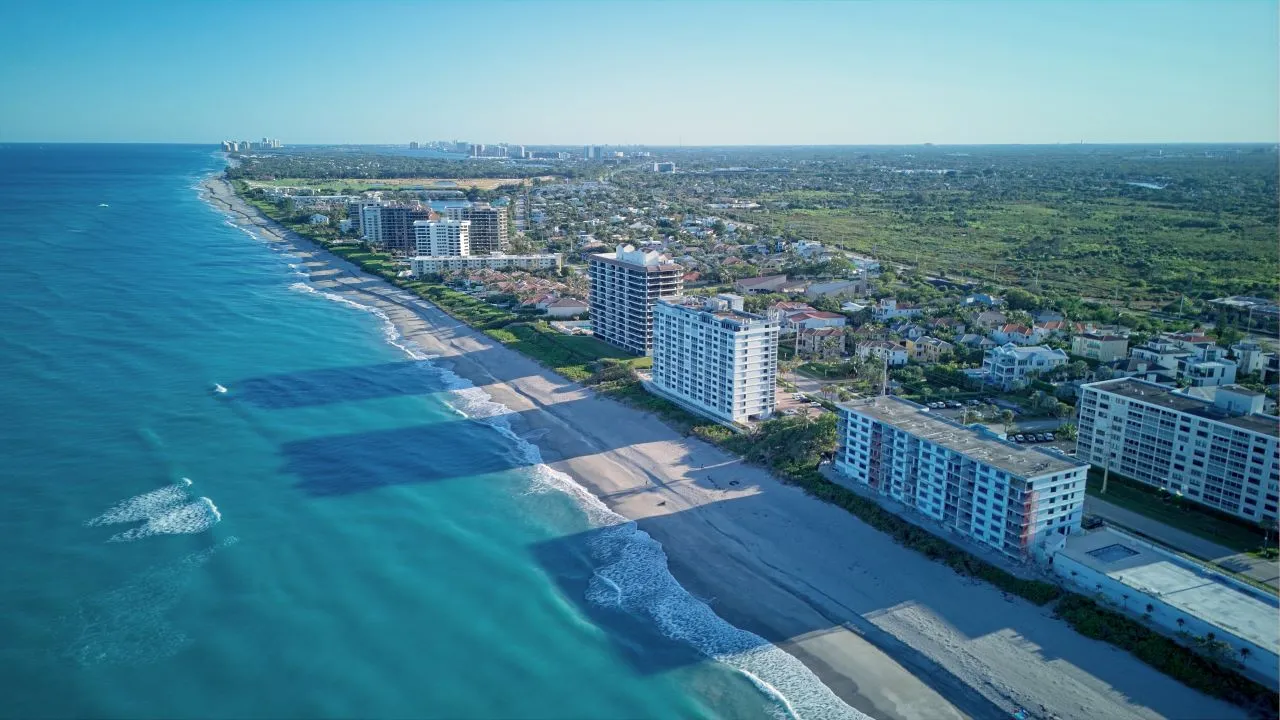
America’s Top Snowbird Destinations for 2026–2027: Florida Leads in Numbers, Texas Wins on Value
For Americans living in colder states, the approach of winter is reason enough to start looking south. Cold weather carries costs that go beyond the heating bill and shoveling snow. Seasonal affective disorder(opens in new tab) is far more prevalent in northern states, so a temporary move south isn’t simply an escape from the cold, but a chance to spend the hardest stretch of winter outdoors and in the sun.

How Much Does Halloween Really Cost in 2026? Plan Wisely to Avoid the Scare of Hidden Costs
Americans’ love for Halloween is almost frightening — this year alone, we are on our way to spending $13.5 billion, according to data from the National Retail Federation(opens in new tab). That breaks down to about $115 Halloween costs per person, a whopping 49% more than 10 years ago.
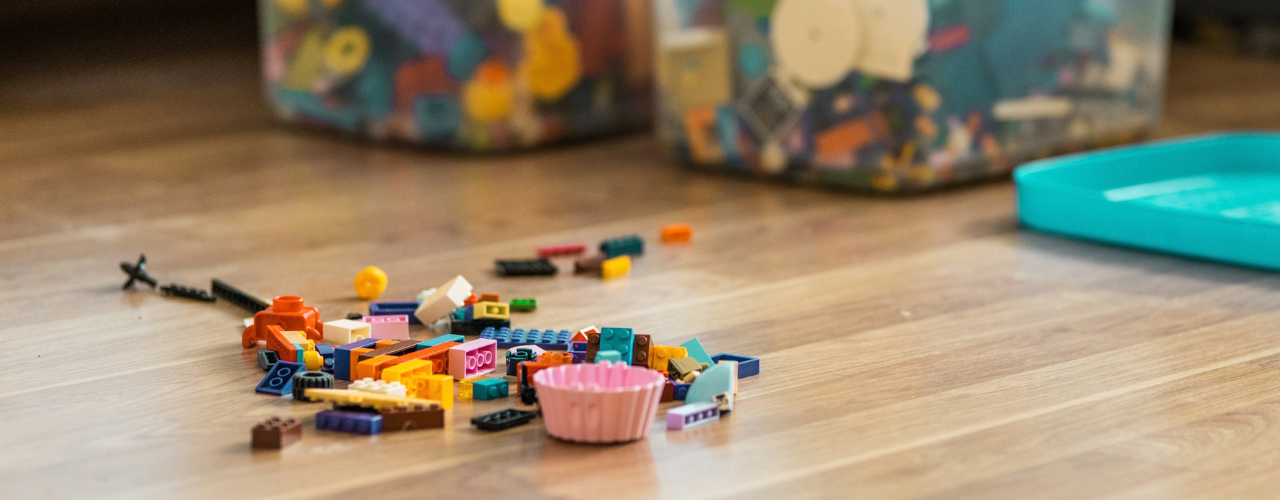
How to Store LEGOs: All the Fun, None of the Clutter
How to store LEGOs largely comes down to how your household uses them. If the bricks are part of everyday play, you need a setup that keeps them within easy reach and makes cleanup quick (for your feet’s sake, at least). Toy storage(opens in new tab) such as simple bins, playmats or containers that children can put away themselves may be enough. Larger or more serious collections usually need more organization, such as labelled drawers for loose pieces, trays for unfinished builds, shelves for completed models and separate storage for retired sets.

Cardboard Costume Guide: Tips and Ideas for a DIY Halloween
Whether for kids or adults, cardboard costume ideas often make the biggest splash once materialized, and that’s for a simple reason: doing a lot with a little is a universally impressive feat (especially in this economy). If you don’t have enough boxes you could temporarily repurpose, don’t worry! There are many places where you can find free moving boxes(opens in new tab), from stores and supermarkets to online groups and recycling drop-off spots. On the run? Try your luck at a self storage(opens in new tab) facility that sells moving supplies, often for cheap. This way, you can choose moving boxes of different shapes and sizes(opens in new tab), so you can make your costumes as complex as you want.

How to Celebrate Halloween: 9 Non-Spooky Ways To Enjoy It
As soon as October starts, it’s the official Halloween month. And while for many people it means it’s open season to get the scare of a lifetime, others, especially families with small children, might prefer to celebrate in a tamer way that’s both kid- and adult-friendly. While you’re likely to find more events where the spook factor is high, here’s how to celebrate Halloween in a not-so-scary way: