US Discretionary Spending Up: Colorado And Utah Top All Other States In Financial Well-Being


Key Takeaways
- Consumer spending on nonessential items in the U.S. increased by 32% from 2018 to 2022, while overall spending jumped by 24%
- Leisure establishments generated the largest share of nonessential spending, with households spending an average of $3,172 on food services and accommodation in 2022
- Colorado and Utah lead the nation in discretionary spending prowess, with solid increases in high-income earners and 27% of total consumer expenditures going to nonessential items
- Despite its high cost of living, Washington state ranks third for financial well-being due to high household incomes and substantial income growth
Contrary to cautionary tales involving high inflation and economic headwinds, spending is picking up steam across the U.S. Beyond our traditional love of retail therapy, the pandemic and subsequent prioritization of present satisfaction have strongly influenced people’s attitudes toward buying. The so-called YOLO spending behavior — which stands for “You Only Live Once” — is increasingly popular among consumers, particularly well-off, younger crowds.
At the end of the pandemic, non-discretionary spending in the U.S., including housing and other essentials, rose by 22% in 2022 compared to 2018. Consumer spending on nonessentials had a significantly higher growth rate of 32%. Americans spent an average of $12,000 on discretionary items — largely involving food and recreation — accounting for 23% of their total spending budget. Meanwhile, inflation rates fluctuated from 2.9% in 2018 to a peak of 9.1% in 2022 and have since decreased to 3.3% in 2024.
This growth was far from linear, as overall spending dropped during the 2020 pandemic but rebounded in 2021. By 2022, leisure establishments such as restaurants and hotels became the main drivers of consumer nonessential expenses, with households spending an average of $3,172 on food services and accommodations. In addition, people spent 60% more on magazines, newspapers, and stationery than in the previous four years, as well as 59% more on recreational goods and services.
Naturally, financial well-being can vary greatly from one place to another. It is generally shaped by factors like wages, income growth patterns, price indexes and local spending habits. This prompted us to conduct a comparative analysis of U.S. states. To see which areas enable residents to enjoy a more lifestyle-centric way of living, we turned to data from the U.S. Bureau of Labor Statistics and the U.S. Census Bureau and compared each U.S. state and Washington, D.C., across a series of indicators related to discretionary spending.
Colorado and Utah, along with coastal states like Washington and California, lead the way in discretionary spending, likely due to higher household incomes and robust economic growth. For example, Utah experienced 25.2% income growth from 2018 to 2022 and saw a 12% increase in high-income earners during the same period — the highest in the nation. This may explain why locals are able to dedicate as much as 27% of their total expenditures to nonessential items, particularly recreational goods.
At the other end of the spectrum, southern states including Oklahoma, Arkansas and Mississippi saw the lowest spending on discretionary items, lowest household income and fewest high-income earners, landing at the bottom of the list in terms of financial well-being. On a brighter note, these states also have some of the very lowest price indexes in the country.
Discretionary spending in the US: Colorado and Utah walk alongside California in facilitating lifestyles for big spenders
Overall, Americans out West seem to have the most discretionary spending prowess, with Colorado and Utah leading the pack. Backed by robust employment sectors, the average household’s nonessential spending in these states makes up 27% of total expenditures. Additionally, both states have growing, younger and more affluent populations that tend to spend more on nonessentials, along with strong economies that provide both the opportunities and means for leisure spending.
Want to know where you can get the most out of your income to enjoy all the fun things in life? We’re spotlighting the 10 states where your discretionary dollar goes the furthest, thanks to a winning mix of high incomes, savvy spending and reasonable costs.
1. Colorado
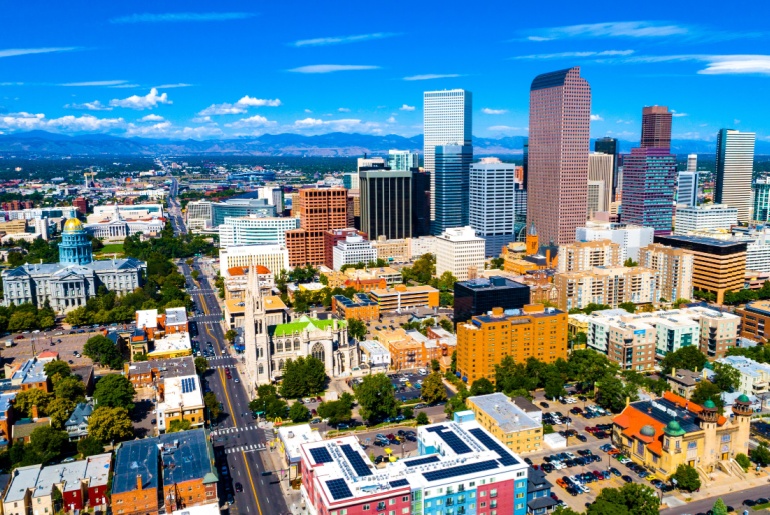
When you think of Colorado’s natural wonders — frequented by hikers, skiers and snowboarders alike — you might also be eager to put your money where your heart is. And that’s just the start: The more time you spend there, the more you’ll find yourself surrounded by award-winning microbreweries, winemakers, top-notch shopping options, and restaurants. It’s hard not to get immersed in a lifestyle of immediate pleasures, especially since the economy is also helping.
Business keeps booming in Colorado, positioning it as a prime state for financial well-being and an elevated lifestyle. Over the last five years, incomes rose by 23.7%, while high-income earners increased by 10%, the sixth-highest growth rate among all states. It may come as no surprise, then, that residents are able to dedicate as much as 27% of their expenditures to nonessential but truly fulfilling goods and services.
2. Utah
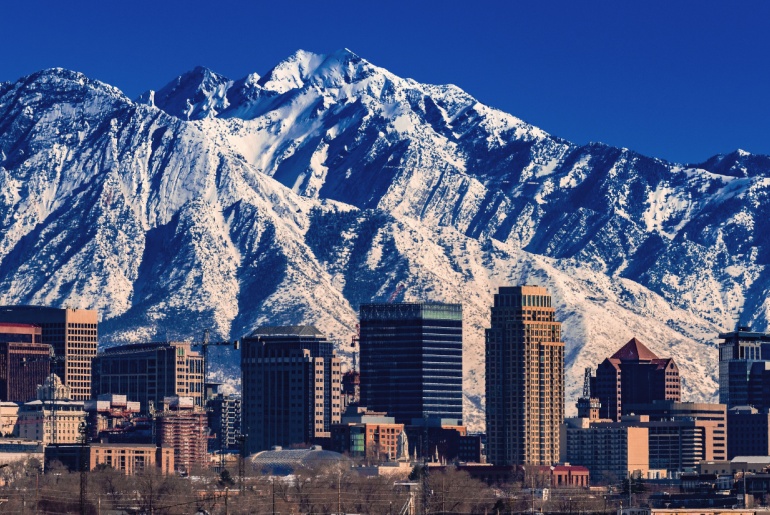
Utah ranks second in the nation in financial well-being, mirroring Colorado closely. The state’s average household also dedicates 27% of their total expenditures to discretionary items, especially on recreational goods and vehicles. These goods make up 9% of their total consumption, a far cry from the rest of the top 10 states (where the number is 5%).
Here, too, the state’s culture of outdoor recreation creates the perfect context for leisure spending, as Utah is home to many sports parks and natural havens that go a long way in residents’ well-being. For many, this feeling of fulfillment is a price they are willing to pay, not to mention that these very assets also bolster Utah’s economy through tourism.
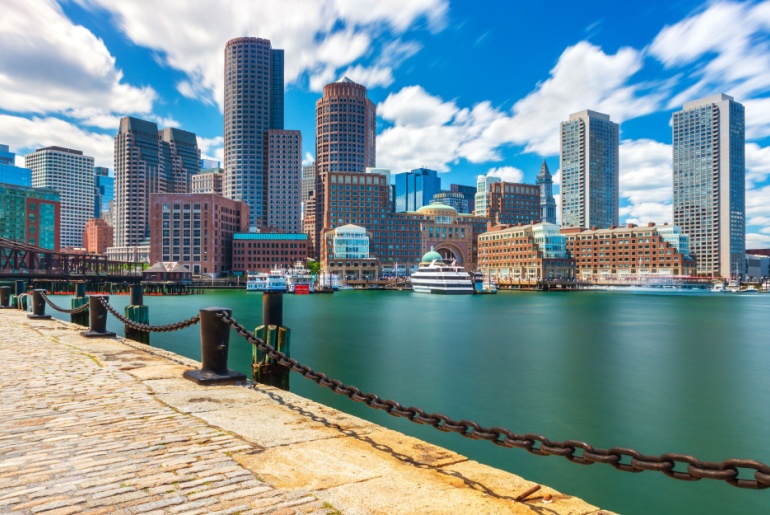
3. Washington
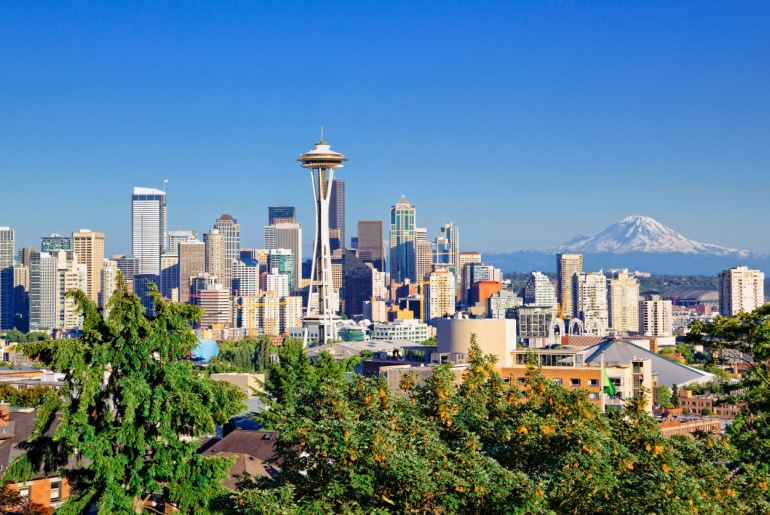
Washington comes third in financial well-being, as its residents are comfortable dishing out 24% of their total expenditures on nonessential items. The state’s high average household income of $125,847 and significant income growth of 26.1% (the third-highest in the nation from 2018 to 2022) drive this spending.
Things like “food away from home” and “recreation services” are some of the things Washingtonians are more willing to splurge on than the average national household. Besides great restaurants and a rich cultural landscape, youngsters are also likely to find plenty of opportunities for career growth. Plus, the state’s 0% personal income tax makes it even more attractive to those seeking relocation.
4. California

The Golden State ranks fourth both in financial well-being and in household income over the 2018-2022 period. Households in California spend 24% of their total consumption on nonessential goods and services, a significant budget compared to the rest of the nation.
At the end of the day, Californians are understandably willing to pay an extra buck to enjoy some of the most vibrant art scenes in the world — whether in cinema, theater or music. It makes even more sense when you add in a thriving sports culture, culinary powerhouses and stunning landscapes.
5. Florida
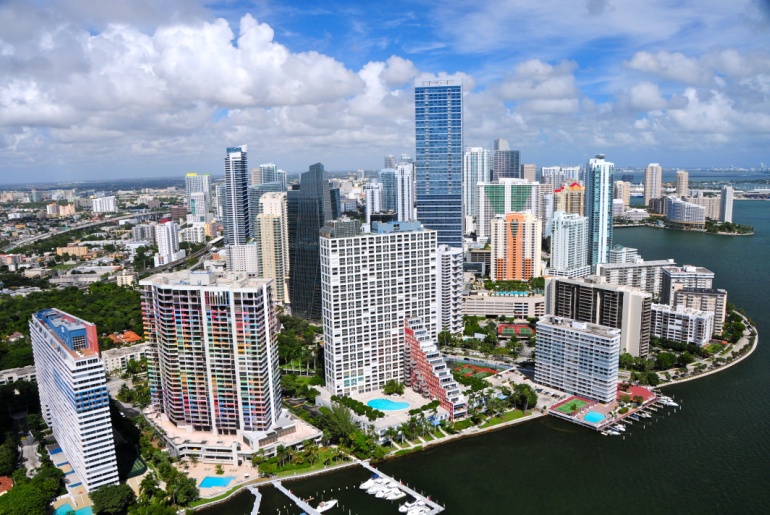
Florida ranks fifth in the country for financial well-being, with households spending 25% of their budgets on nonessential items. The Sunshine State had the eighth-highest income growth from 2018 to 2022, and it’s also brimming with retail options that make it easy to splurge.
From luxury shopping to hidden gems, the Greater Miami area is a shopper’s paradise for those looking to enjoy their hard-earned money. It’s no wonder it topped our list of top destinations for retail therapy. And let’s not forget about the luxury cruises and theme parks that make Florida so famous — and money-draining.
6. Massachusetts
Massachusetts comes in sixth place overall, mainly propelled by the third-largest household income in the country at $133,823, as well as the third-largest budget dedicated to nonessentials. Despite a high price index of 109.39, residents allocate 23% of their expenditures to discretionary items and services, with per capita spending at $14,638.
Income growth has been modest at 21.1%, but the presence of high-income earners supports substantial discretionary spending, particularly in food services and recreational activities. The truth is, with so many great outdoor options including hiking, biking and skiing in the Berkshires, Cape Cod National Seashore and the many state parks, splurging on fun is very easy. And that’s not to mention Boston hot spots like Back Bay and the North End, which are packed with fashion items just waiting to be picked.
7. Washington, D.C.
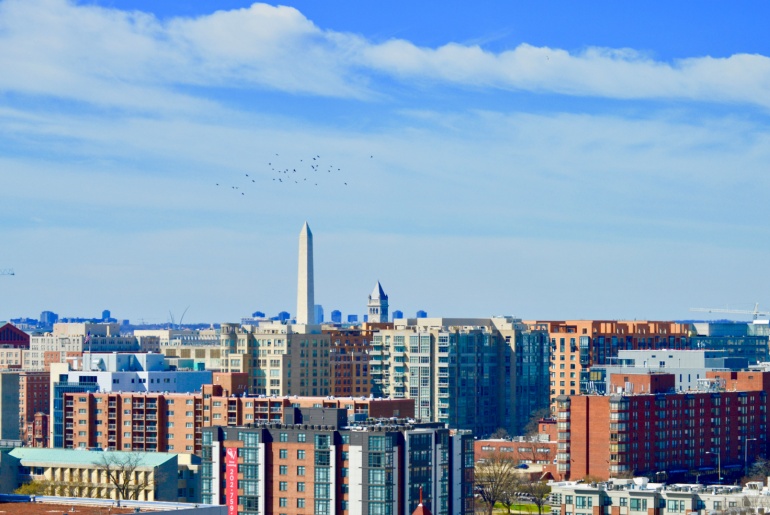
Despite having the highest price index in the nation, Washington, D.C., ranks seventh in financial well-being overall. Local incomes tend to bridge the affordability gap, with households bringing in approximately $149,000, the highest in the nation. This explains the hefty budget allocated to discretionary items, roughly $16,777.
Income growth in D.C. was moderate at 19.1% over the previous five-year cycle, but the concentration of high-income earners and significant spending on food services and accommodations highlight the area’s economic vitality.
8. New Hampshire
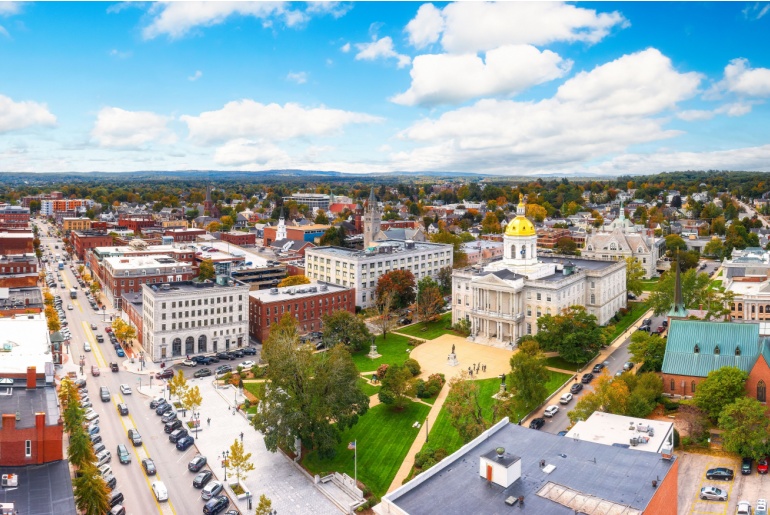
In the Granite State, residents dedicate 21% of their expenditures to nonessentials, with per capita spending at $12,634. This lands New Hampshire in a comfortable spot when it comes to financial well-being and indulging in whatever your heart desires.
While the New Hampshire Business Review predicts a cooldown in the state’s consumer spending over 2024 (owing partly to the depletion of savings made during the pandemic), high-income households are likely to keep frequenting the region’s more high-end shopping and dining venues.
9. Alaska
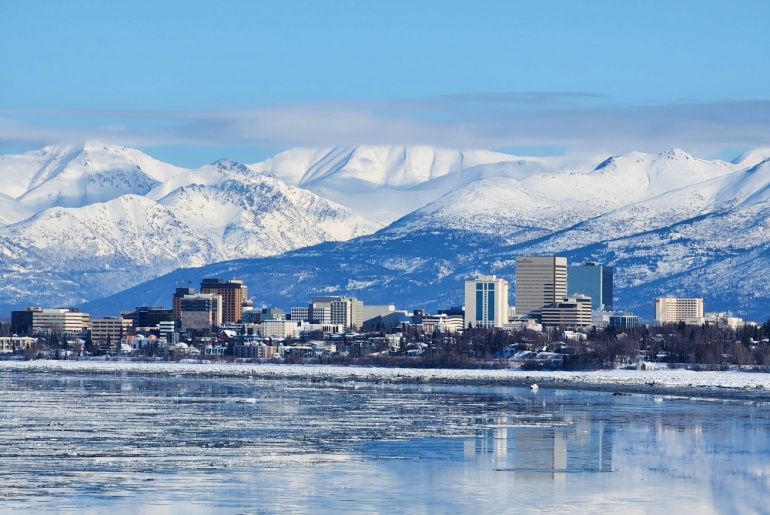
Alaska is also doing well in consumer discretionary spending, with residents dedicating 24% of their expenditures to nonessential items. Despite a price index of 101.99, Alaskans spend heavily on recreational goods and vehicles when compared to other states, perhaps as a form of finding comfort in a rugged landscape.
And although income growth lagged more than in any other state during the previous five-year cycle, the latest data shows that things are picking up: Alaska has had the second-highest wage growth from 2023 to 2024 (5.5%).
10. Nevada
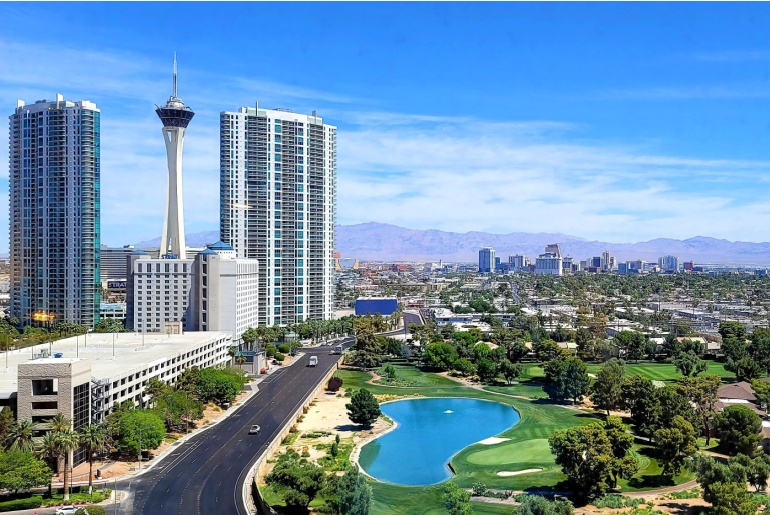
Nevada wraps up our top 10 states where you can stretch your discretionary buck. Even with a modest income growth of 21.5% from 2018 to 2022, Nevadans splurged 25% of their expenditures on nonessential goods and services — not a bad trade-off when you consider the exciting lifestyle that the Silver State is famous for.
And the trend may well continue as the recent economic boom has invigorated the state despite lagging employment rates. Las Vegas has in fact recently seen a noticeable shift from spending on goods to indulging in experiences. According to the Bank of Nevada, dining out has surged by 40% since the pandemic, and events are consistently selling out.
Thrifty spenders: Southern states among the worst states for spending freely
When it comes to financial well-being, residents of some southern states have a harder time finding the capital to spend on nonessentials. Mississippi, Arkansas and Oklahoma have some of the very lowest household incomes in the country, and their average income growth does not sit much better.
Still, other states in the bottom 10 spots have shown significant income growth during 2018 — places like New Mexico (#11 in income growth) and West Virginia (#17), which had the lowest percentage of consumer discretionary spending at 18% of total expenditures.
Where self storage can allow spendthrifts to keep their homes clutter-free
While spending has increased and people continue their love affair with stuff, living spaces are decreasing. Self storage is one sector of real estate that can help manage our homes more effectively, even as we tend to own more items, whether apparel, camping and hobby gear or furniture and appliances.
We’ve broken down self storage supply and prices by state to see where people get access to more storage space — often at a fraction of the cost of housing. The cheapest states for storage space are South Dakota and Wyoming, where the price per square foot of self storage space is $0.67. Montana, the state with the third-cheapest price per square foot, is also home to the largest self storage inventory per capita, roughly 24 square feet per person. Among the top ten states for financial well-being, you will find the most affordable self storage units in Utah, with an average of $110 for a 10x10 non-climate controlled unit.
Self Storage Availability and Pricing in the US by State
| State | Self Storage Price/ Sq. Ft. | Self Storage Street Rate (10x10 NCC) | Self Storage Inventory (sq. ft. per capita) | Self Storage Inventory (sq. ft. ) |
|---|---|---|---|---|
| Colorado | $1.11 | $121 | 8.43 | 36,805,266 |
| Utah | $1.02 | $110 | 10.27 | 26,546,195 |
| Washington | $1.30 | $143 | 8.26 | 50,611,855 |
| California | $1.59 | $176 | 6.42 | 230,686,471 |
| Florida | $1.19 | $118 | 9.11 | 174,215,208 |
| Massachusetts | $1.43 | $148 | 4.51 | 28,221,800 |
| District Of Columbia | $1.79 | $157 | 2.16 | 2,010,302 |
| New Hampshire | $1.08 | $119 | 8.88 | 7,703,211 |
| Alaska | $1.62 | $168 | 7.29 | 2,248,378 |
| Nevada | $1.05 | $115 | 11.33 | 31,768,997 |
| Maine | $1.13 | $123 | 8.53 | 4,667,792 |
| Virginia | $1.21 | $124 | 7.99 | 53,480,146 |
| Oregon | $1.18 | $135 | 8.45 | 25,089,707 |
| Arizona | $1.09 | $115 | 8.68 | 47,365,940 |
| Montana | $0.69 | $81 | 23.69 | 15,521,887 |
| Delaware | $1.17 | $128 | 5.54 | 4,004,199 |
| Rhode Island | $1.28 | $135 | 4.88 | 5,158,631 |
| Connecticut | $1.26 | $133 | 5.3 | 17,095,183 |
| Illinois | $1.06 | $106 | 5.5 | 53,764,297 |
| New York | $1.74 | $172 | 3.75 | 67,606,564 |
| New Jersey | $1.42 | $147 | 4.15 | 44,032,006 |
| North Carolina | $0.92 | $96 | 9.81 | 74,863,175 |
| Hawaii | $2.78 | $286 | 3.45 | 2,762,433 |
| Pennsylvania | $1.11 | $119 | 4.91 | 48,660,550 |
| Minnesota | $0.94 | $100 | 6.59 | 23,111,897 |
| South Dakota | $0.67 | $81 | 13.99 | 7,124,989 |
| Georgia | $0.95 | $96 | 9.39 | 71,529,262 |
| Maryland | $1.28 | $136 | 6 | 32,071,080 |
| Tennessee | $0.93 | $98 | 9.78 | 45,425,411 |
| Texas | $0.94 | $96 | 10.98 | 252,850,919 |
| Idaho | $0.81 | $99 | 17.69 | 15,911,642 |
| South Carolina | $0.92 | $94 | 10.22 | 36,876,669 |
| Wisconsin | $0.83 | $91 | 7.35 | 24,667,298 |
| Missouri | $0.88 | $97 | 7.82 | 31,874,071 |
| Nebraska | $0.73 | $88 | 8.27 | 9,432,461 |
| Ohio | $0.82 | $94 | 6.35 | 55,519,268 |
| Iowa | $0.80 | $86 | 7.14 | 7,514,355 |
| Alabama | $0.84 | $85 | 11.21 | 25,379,241 |
| Michigan | $0.91 | $103 | 6.11 | 43,070,233 |
| New Mexico | $0.96 | $100 | 9.47 | 11,296,267 |
| Indiana | $0.80 | $88 | 7.95 | 37,173,316 |
| Wyoming | $0.67 | $77 | 15.25 | 5,768,084 |
| Kansas | $0.82 | $89 | 7.1 | 11,283,142 |
| Kentucky | $0.84 | $90 | 7.93 | 17,374,346 |
| Louisiana | $1.02 | $97 | 10.72 | 28,495,635 |
| Oklahoma | $0.70 | $76 | 12.4 | 30,273,328 |
| Arkansas | $0.74 | $76 | 14.38 | 18,453,009 |
| Mississippi | $0.87 | $91 | 11.46 | 11,568,865 |
All things considered, paying attention to finances and adjusting spending habits to fit your personal budget is crucial for enjoying a pleasant life. Location can make or break the deal, and choosing a state that aligns with your financial goals and lifestyle preferences is paramount when planning a move.
Whether you’re drawn to the vibrant culture of California, the outdoor adventures of Colorado or Alaska’s rugged landscape, these top-ranking states revealed by our analysis offer diverse opportunities and economic strengths — perfect for optimized and carefree discretionary spending.
See where your state ranks in the table below, which includes synthesized data for all 50 states and DC.
What the experts are saying
We've also interviewed several experts in finance and economics to better understand the current impact of consumer spending habits.
Doug Ressler
Business Intelligence Manager at Yardi Matrix
How do you perceive consumer sentiment these days?
Doug Ressler, Business Intelligence Manager at Yardi Matrix
We're currently witnessing a rise in consumer spending in the U.S., which overall rose by 24% in 2022 compared to 2018, according to BLS data, along with a rise in renter incomes. The average monthly income of apartment tenants has surged nearly 4% annually, reaching an all-time high in the second quarter of this year.
With more financial resources in their hands, consumers can afford more housing options, resulting in increased activity in the rental market. However, this also means that there's increased demand for housing, which can drive up costs as people compete for a limited supply of properties.

Is the rise in earnings and spending reflected in current housing trends?
Strictly referring to the multifamily market, the rise in income has significantly expanded the renter pool, driving the number of occupied rental units to more than 160,000 nationwide — the strongest quarterly net absorption volume in nearly three years. The absorption volume in the first half of this year surpassed the total for 2023 by almost 35,000 units.
Indirectly, the self-storage market also benefits from increased spending power, as the more people own, the greater the pressure on living spaces. This has led to the strong performance of the self-storage sector, which continues to add new supply at an impressive pace. More than 270 million square feet of storage space was built in the last five years ending in 2023 — that's equivalent to 14.3% of the total inventory. 2024 is expected to see the completion of another 54.4 million rentable square feet.
Why are more high-earning households choosing to rent instead of buy?
Many high-earning households are choosing to remain renters because the median monthly mortgage payment increased by nearly $70 in the second quarter. This has widened the cost gap between renting and buying to approximately $1,290 per month, just 3% below the record high reached in the fourth quarter of 2023. This makes renting a more attractive option, even for those with substantial incomes.
Patricia Huddleston
Professor of Retailing, Department of Advertising and Public Relations, Michigan State University
How have consumer spending habits changed in the years following the pandemic?

Patricia Huddleston | Director, Information and Media PhD Program
During the pandemic, most consumers had to shop online (vs. in-store) for most non-essential products. Retailers responded by offering buy-online pickup in-store (BOPIS) and reduced or free shipping. BOPIS has remained a popular option for consumers. Due to the pandemic, e-commerce growth is higher than overall retail sales growth, although it is still less than 20 % of total retail sales (15.3% in 2023). For example, in 2023, e-commerce growth was estimated at 7.4% compared to 2.6% overall retail growth.
While consumers continue to consult online sites during their shopping journeys, there’s a generational difference in the proportion of total shopping done online. For example, Millennials, Gen X, and Gen Z do more than 50% of their shopping online, while Boomers and the Swing Generation (1930-1945) are doing less than 50%. Millennials and Gen Z are more likely to use mobile technology when searching for and purchasing products.
At the other end of the shopping continuum, for brick-and-mortar stores, consumers shop there for the tactile experience, immediate gratification, and no shipping charges. Many retailers have designed engaging in-store experiences to increase consumers’ shopping enjoyment. For example, the Lululemon store in Lincoln Park, IL, has a yoga studio, meditation area, and a café to engage and delight their customers.
Given the current economic conditions, what trends do you foresee in consumer discretionary spending in the near future?
Several sources provide insights into this question. Mintel’s State of Retail and E-commerce report observed differences between generations in their spending. Post-pandemic, health and personal care stores saw sales gains, while consumers cut back on discretionary categories like building and garden supplies and furniture and home furnishings stores. Generational differences are evident here, too, with Baby Boomers splurging more on travel than younger consumers. Gen X, Millennials, and Gen Z do not have the same discretionary income to spend on travel due to higher housing costs, raising and educating children, and paying down student loan debt. Thus, their splurges are different. Gen Z & Millennials treat themselves to beauty, personal care, and jewelry items, while Gen X splurges on groceries and travel.
Which categories of non-essential goods and services generate the most consumer spending and why?
To provide a point of comparison between essential and non-essential goods, the average annual food expenditure in 2022 was $9343. After the pandemic, spending on travel, clothing and accessories, entertainment, and travel generated the most consumer spending. According to Statista, spending on apparel per household (2022) was $1945, dining out (2022) per household was $3639 (vs. $3256 in pre-pandemic 2019), and per household spending on entertainment (2022) was $3458. While it is difficult to draw direct comparisons because spending per household statistics were unavailable, total travel expenditures in the U.S. in 2022 were $1 trillion compared to $1.17 trillion in 2019. Travel spending is expected to continue to increase for the next several years.
The social isolation brought about by the pandemic is helping to drive sales related to travel, dining out, and entertainment. People strongly desire to reconnect with family and friends in social settings, minus the social distancing experienced during the pandemic. Spending on clothing and accessories may be driven by leisure social interactions, but reducing work-from-home opportunities may drive sales of work and casual wear. Athleisure wear, popular during the pandemic, may not be appropriate for F2F work settings.
Dan Jin
Ph.D. Assistant Professor, Retail, Hospitality, & Tourism Mgmt., University of Tennessee, Knoxville
How have consumer spending habits changed in the years following the pandemic?

Dan Jin, Ph.D. Assistant Professor
Panic buying was a significant issue immediately after the pandemic began, yet the panic buying subsided after 2022, due to inflation. Despite this, conspicuous consumption has continued to dominate since then. According to the Bureau of Labor Statistics in the U.S., consumer spending in the second quarter of 2020 was down 9.8 percent compared to the same period in 2019. People have struggled with money management, and credit and debit card data revealed a nearly 20 percent increase in online spending since January 2020, reflecting a pandemic-induced surge in e-commerce.
Since the pandemic, we've seen a big shift in how people spend their money. People are choosing to travel domestically more, prioritizing visits to family and friends over international trips. Grocery stores are seeing a boom because more folks are cooking at home instead of eating out. At the same time, people are being more careful with their retail spending, focusing on buying what they really need and cutting down on unnecessary purchases.
Which categories of non-essential goods and services generate the most consumer spending and why?
Categories of non-essential goods and services that generate the most consumer spending include entertainment, dining out, travel, and fashion. People love spending on entertainment like movies, concerts, and video games because these activities offer relaxation and enjoyment. Dining out remains popular as it provides a social experience and a break from cooking at home. Travel is another major category, with consumers eager to explore new places and visit loved ones, especially after being confined during the pandemic. Personal luxury items, such as designer clothes, jewelry, and high-end electronics, also see significant spending as they offer a sense of status and self-indulgence. Additionally, personal care services like dermatologists, yoga classes, gyms, and country club memberships are in high demand as people invest in their health, well-being, and leisure. These categories thrive because they cater to people's desires for enjoyment, convenience, self-expression, and personal wellness.
Ted Rossman
Senior Industry Analyst, Bankrate.com
Can you comment on how consumer spending habits are evolving at the moment? What changes do you foresee in the near future?

Ted Rossman | Senior Industry Analyst at Bankrate
My biggest takeaway is that we've seen a big shift away from physical goods the past couple of years in favor of spending on experiences. Categories such as travel, dining and live entertainment have been booming. I wasn't surprised that 2022 was a big year for travel, dining, concerts and sporting events, once pandemic restrictions eased. But I have been surprised that the trend has kept going. 2023 was a record year for TSA passenger screenings and this year is well ahead of that pace. What started as pent-up demand has become a major trend. Consumers have grown more cautious over the past year due to high prices and high interest rates, but if there's one thing they're still happy to splurge on, it's travel. You only live once, as the saying goes, and a lot of Americans (especially young adults) are prioritizing these types of experiential spending. More than 1 in 3 Americans are willing to go into debt this year for travel, dining and live entertainment.
It's interesting because usually when people worry about the economy they're quick to cut back on discretionary expenses such as these. And there have been plenty of economic worries the past couple years. Consumer sentiment remains well below pre-pandemic levels and inflation has greatly impacted Americans' buying power. But in spite of higher prices, consumers continue to gravitate toward experiences. Much of this is due to pandemic aftermath (as in, we really missed things like travel and concerts), but some also seems to represent a fundamental shift. There are a lot of young adults who are pessimistic about their student loans and their prospects to buy a home and achieve other traditional milestones such as marriage and having kids. But they can live for today and enjoy these life experiences.
To be fair, some of the drop in goods sales was bound to happen because demand surged in 2020 and 2021 for pandemic reasons. People were stuck at home and they did kitchen renovations and bought new TVs and video game systems and so on. We're seeing potential early signs that some of that demand may be starting to come back, in part due to lower inflation and also due to natural product replacement cycles (electronics wear out, become dated, etc.). Still-high mortgage rates and home prices are also discouraging home purchases but could lead more people to renovate and stay in place. The pendulum has swung from goods (2020 and 2021) to experiences (2022-24). I expect we'll see a more normal split in 2025.
Methodology
This study was performed by StorageCafe, an online platform that provides storage unit listings across the nation.
As part of this research, we calculated residents’ financial well-being in terms of four metrics:
- Personal consumption expenditures (60%). Source: U.S. Bureau of Labor Statistics.
- Price index in terms of regional price parities by state (10%). Source: U.S. Bureau of Labor Statistics.
- Household income in 2022 (10%). Source: U.S. Census Bureau.
- Income growth over 2018-2022 (10%). Source: U.S. Census Bureau.
- Growth in high-income earners — meaning persons earning above the median income of $100,000 (10%). Source: U.S. Census Bureau.
For data regarding discretionary spending, we looked at the figures provided by the U.S. Bureau of Economic Analysis in its analysis of personal consumption expenditures by state and by type of product. Each category includes the dollar amount and percentage of total expenditures for goods and services including:
- Food services and accommodations: dining out, going out to cafes, staying at hotels
- Recreational goods and vehicles: bicycles, boats, RVs, fishing rods, sports equipment
- Recreation services: fitness center memberships, amusement park tickets, concert tickets
- Recreational items: board games, musical instruments
- Alcohol for off-premises consumption: alcoholic beverages consumed at a location other than the point of sale
- Personal care and clothing services: hair salons and barbershops, tattoo and piercing studios, tailoring and alterations
- Other durable goods: furniture, home appliances, electronics, tools and equipment, jewelry
- Professional and other services: legal services, accounting and financial advisory, health care services
In addition, we also used data on self storage from Yardi Matrix, StorageCafe’s sister division and a business development and asset management tool for brokers, sponsors, banks and equity sources underwriting investments in the multifamily, office, industrial and self storage sectors.


Best RV Destinations in the U.S. (2026): Oceanfront Drives Beat America’s Usual RV Favorites
The real difference between an ordinary RV stop and a standout trip often comes down to the campground or resort you choose.

Where to Donate Furniture in NYC (With Free Pick-Up Options)
Finding somewhere to donate furniture in NYC is more complicated than it should be. Not every organization accepts large items, pick-up availability is inconsistent, and the options that do exist aren’t always easy to find in one place. If you’re specifically hoping to donate furniture with free pick-up, the list of options gets even shorter.

Clean Out, Give Back: Where to Donate Clothes in Los Angeles
Few cities reinvent themselves like Los Angeles, and wardrobes tend to follow suit. Between changing seasons, evolving trends and an endless calendar of occasions worth dressing for, closets fill up fast, making the question of where to donate clothes in Los Angeles one that most Angelenos eventually find themselves asking.

How to Store Shoes Based on Your Personality
Your shoe closet is lying — not about how many pairs you own (that number is likely higher than you’d admit), but about who you are. The way you approach shoe storage, or avoid it, is one of the more honest reflections of your personality that exists in a home.

Tiny Home Storage Ideas for Every Nook and Cranny
Tiny home storage is one of those challenges that sounds straightforward until you’re standing in 200 square feet wondering where the winter coats are supposed to go. You didn’t downsize for the storage anxiety — you did it for the coziest place you’ve ever called home, a wallet that finally feels lighter, and a minimalist lifestyle that suits you just fine.

Best States for Electric Vehicles (2026): The West Leads EV Adoption, Oklahoma Speeds Up
Last updated: June 22, 2026.
")
Self Storage Discounts: Types, Tips and How to Get the Best Deals for Your Needs
When you start looking for a self storage unit to rent, one thing becomes clear very quickly: self storage discounts are a standard part of the industry. From introductory specials to military savings and online-only rates, operators frequently offer promotions designed to make renting a unit more affordable and flexible.

How Self Storage Can Help Event Planners
When you attend a great event, you rarely think about the choreography happening behind the curtain or after the last guest leaves. Unless, of course, you’re an event planner — an industry that has grown 8.6% per year on average over the five years between 2020 and 2025. It shows no signs of slowing down either, as small businesses and event planners continue to carve out their place across America.

Most Fun Cities In The U.S.: Miami & Orlando Rule The Fun Access Map, While Phoenix Reveals A Growing Leisure Divide
Are Americans going out less, or just living in places that make going out harder?