
Amid National Self Storage Price Deceleration, Two Waterfront Cities See Street Rates Spike

Key takeaways:
- Self storage rates have been decreasing nationally and currently clock in at $126 on average
- Buffalo, NY, bucks the national trend, showing off the largest self storage rent growth (7.4%)
- The West dominates the top 20 cities with the most significant street rate growth, with 8 cities representing the region
- At the other end of the spectrum, New Orleans, LA, and Modesto, CA, recorded the highest price decreases, 16.9% and 9.7%, respectively
After the robust construction activity that the U.S. self storage sector experienced over the last decade, the market started to cool off in 2022 and prices followed suit. Street rates for standard 10’x10’ non-climate-controlled units had gone down 2.3% year-over-year in December 2022 and are hovering at around $126/month on average.
However, street rates go against the national trend in many locations across the U.S. and show steep increases, especially in places where demand outstrips supply. According to our most recent analysis of Yardi Matrix data, 37% of the 150 largest cities in the U.S. saw positive rent growth year-over-year, with Buffalo, NY, and Tacoma, WA, coming out on top for the biggest self storage rent increases.
"2023 is shaping up to be a good year for self storage, with operator sentiment generally optimistic. Most storage providers are expecting to still see their businesses grow despite the economic headwinds that brought in concerns about high increases in insurance, utilities, and labor costs," according to Doug Ressler, business intelligence manager at Yardi Matrix. "Although cooling off, street rates stay more than 10% above their pre-pandemic levels. Moreover, demand seems to be stabilizing, with the customer base remaining diverse and growing in numbers," he also added.
Self Storage Rent Changes in the 150 Biggest U.S. Cities
| Rank | City | Street Rate Dec. 2022* | Y-o-Y Change | Self Storage per Capita (sq. ft.) |
|---|---|---|---|---|
| 1 | Buffalo, NY | $129 | 7.4% | 1.8 |
| 2 | Tacoma, WA | $154 | 5.8% | 4.4 |
| 3 | Bakersfield, CA | $85 | 5.7% | 8.9 |
| 4 | Aurora, IL | $97 | 4.6% | 2.1 |
| 5 | Saint Petersburg, FL | $144 | 4.4% | 5.4 |
| 6 | Greensboro, NC | $91 | 4.2% | 9.6 |
| 7 | Fresno, CA | $116 | 4.1% | 7.2 |
| 8 | Lincoln, NE | $99 | 4.1% | 6.4 |
| 9 | Peoria, AZ | $127 | 3.9% | 4.2 |
| 10 | Omaha, NE | $86 | 3.8% | 6.7 |
| 11 | Fort Wayne, IN | $100 | 3.4% | 6.7 |
| 12 | Anchorage, AK | $182 | 2.9% | 6.2 |
| 13 | Boise City, ID | $116 | 2.6% | 10.9 |
| 14 | Little Rock, AR | $87 | 2.6% | 10.4 |
| 15 | Augusta, GA | $89 | 2.6% | 9.0 |
| 16 | Virginia Beach, VA | $112 | 2.5% | 10.5 |
| 17 | Eugene, OR | $126 | 2.3% | 7.1 |
| 18 | Santa Clarita, CA | $195 | 2.2% | 3.7 |
| 19 | Hayward, CA | $172 | 2.0% | 2.7 |
| 20 | Frisco, TX | $119 | 2.0% | 4.0 |
| 21 | Rancho Cucamonga, CA | $176 | 1.9% | 4.5 |
| 22 | Tallahassee, FL | $108 | 1.9% | 9.4 |
| 23 | Moreno Valley, CA | $139 | 1.9% | 4.3 |
| 24 | Reno, NV | $123 | 1.9% | 14.9 |
| 25 | Mobile, AL | $90 | 1.8% | 8.9 |
| 26 | Brownsville, TX | $94 | 1.7% | 4.6 |
| 27 | Oxnard, CA | $164 | 1.6% | 4.8 |
| 28 | Durham, NC | $100 | 1.6% | 8.8 |
| 29 | Fremont, CA | $170 | 1.5% | 3.4 |
| 30 | Lexington, KY | $109 | 1.5% | 7.0 |
| 31 | Grand Prairie, TX | $108 | 1.4% | 3.2 |
| 31 | Toledo, OH | $93 | 1.3% | 4.1 |
| 31 | Arlington, VA | $240 | 1.2% | 1.1 |
| 34 | Spokane, WA | $121 | 1.2% | 7.0 |
| 35 | Oklahoma City, OK | $79 | 1.1% | 8.3 |
| 36 | Norfolk, VA | $101 | 1.1% | 5.1 |
| 37 | Newark, NJ | $137 | 1.1% | 0.9 |
| 38 | Fort Collins, CO | $112 | 1.0% | 7.9 |
| 38 | Huntington Beach, CA | $187 | 1.0% | 2.5 |
| 38 | San Antonio, TX | $113 | 1.0% | 8.6 |
| 41 | Riverside, CA | $135 | 0.9% | 5.5 |
| 42 | Nashville, TN | $121 | 0.9% | 6.7 |
| 43 | Madison, WI | $113 | 0.8% | 4.1 |
| 44 | Vancouver, WA | $136 | 0.8% | 8.2 |
| 45 | Long Beach, CA | $191 | 0.8% | 2.1 |
| 46 | Arlington, TX | $98 | 0.8% | 5.8 |
| 47 | Salem, OR | $134 | 0.6% | 7.3 |
| 48 | Denver, CO | $133 | 0.4% | 3.4 |
| 49 | San Diego, CA | $183 | 0.3% | 3.8 |
| 50 | Knoxville, TN | $108 | 0.3% | 9.2 |
| 51 | Boston, MA | $182 | 0.3% | 0.7 |
| 52 | Tulsa, OK | $80 | 0.3% | 8.7 |
| 53 | Des Moines, IA | $89 | 0.2% | 4.4 |
| 54 | Cleveland, OH | $112 | 0.2% | 2.2 |
| 55 | Santa Ana, CA | $185 | 0.1% | 1.6 |
| 55 | McKinney, TX | $101 | 0.0% | 7.6 |
| 57 | Charlotte, NC | $103 | -0.1% | 7.0 |
| 58 | Anaheim, CA | $190 | -0.1% | 1.4 |
| 58 | Honolulu, HI | $276 | -0.1% | 2.8 |
| 60 | Salt Lake City, UT | $118 | -0.5% | 3.2 |
| 61 | Rochester, NY | $125 | -0.6% | 3.3 |
| 62 | Columbus, OH | $91 | -0.7% | 4.3 |
| 62 | Cape Coral, FL | $157 | -0.7% | 6.8 |
| 62 | Pembroke Pines, FL | $191 | -0.7% | 2.3 |
| 65 | Tampa, FL | $119 | -0.7% | 6.7 |
| 66 | Raleigh, NC | $95 | -0.9% | 7.1 |
| 66 | Hialeah, FL | $167 | -0.9% | 2.1 |
| 68 | Grand Rapids, MI | $104 | -0.9% | 3.6 |
| 69 | St Paul, MN | $120 | -1.0% | 3.6 |
| 70 | Albuquerque, NM | $104 | -1.1% | 7.6 |
| 71 | Fort Worth, TX | $99 | -1.2% | 6.0 |
| 72 | Dallas, TX | $114 | -1.2% | 5.0 |
| 73 | New York City, NY | $242 | -1.3% | 2.4 |
| 74 | Corpus Christi, TX | $99 | -1.4% | 10.3 |
| 75 | San Jose, CA | $171 | -1.5% | 3.8 |
| 76 | Austin, TX | $121 | -1.5% | 7.7 |
| 77 | Irvine, CA | $164 | -1.6% | 4.7 |
| 78 | Tucson, AZ | $120 | -1.6% | 7.6 |
| 79 | Orlando, FL | $117 | -1.6% | 6.6 |
| 79 | Plano, TX | $102 | -1.7% | 5.3 |
| 81 | Houston, TX | $96 | -1.8% | 6.7 |
| 82 | Louisville, KY | $92 | -1.9% | 7.4 |
| 83 | Pittsburgh, PA | $111 | -2.0% | 3.5 |
| 84 | Tempe, AZ | $123 | -2.0% | 4.1 |
| 85 | Lubbock, TX | $89 | -2.0% | 14.5 |
| 86 | Milwaukee, WI | $99 | -2.0% | 3.4 |
| 87 | Los Angeles, CA | $253 | -2.2% | 1.8 |
| 88 | Baton Rouge, LA | $100 | -2.3% | 11.2 |
| 89 | Lancaster, CA | $133 | -2.3% | 9.1 |
| 90 | Akron, OH | $91 | -2.4% | 3.9 |
| 90 | Mesa, AZ | $110 | -2.6% | 5.8 |
| 90 | El Paso, TX | $99 | -2.7% | 5.9 |
| 90 | Chandler, AZ | $134 | -2.8% | 4.5 |
| 90 | Kansas City, MO | $109 | -2.8% | 4.1 |
| 90 | Richmond, VA | $105 | -2.9% | 5.6 |
| 90 | Gilbert, AZ | $123 | -3.0% | 3.7 |
| 90 | Columbus, GA | $98 | -3.2% | 11.5 |
| 90 | Chula Vista, CA | $179 | -3.2% | 3.6 |
| 90 | Glendale, AZ | $114 | -3.3% | 2.6 |
| 90 | Wichita, KS | $84 | -3.5% | 6.5 |
| 90 | Overland Park, KS | $95 | -3.5% | 2.8 |
| 102 | Seattle, WA | $189 | -3.6% | 3.7 |
| 103 | Garland, TX | $97 | -3.6% | 3.5 |
| 104 | San Francisco, CA | $264 | -3.7% | 2.1 |
| 105 | Indianapolis, IN | $84 | -3.7% | 6.7 |
| 106 | Aurora, CO | $115 | -3.7% | 4.1 |
| 107 | Winston-Salem, NC | $100 | -3.7% | 6.5 |
| 108 | Birmingham, AL | $96 | -3.9% | 7.1 |
| 109 | Phoenix, AZ | $123 | -4.0% | 4.8 |
| 110 | Baltimore City, MD | $121 | -4.0% | 3.4 |
| 111 | Cary, NC | $95 | -4.0% | 4.6 |
| 112 | Memphis, TN | $87 | -4.1% | 7.4 |
| 113 | Salinas, CA | $199 | -4.2% | 5.6 |
| 114 | Chicago, IL | $128 | -4.2% | 3.4 |
| 115 | Minneapolis, MN | $107 | -4.3% | 2.1 |
| 116 | Saint Louis, MO | $103 | -4.3% | 4.7 |
| 117 | Cincinnati, OH | $95 | -4.3% | 3.9 |
| 118 | Oceanside, CA | $165 | -4.5% | 3.0 |
| 119 | Scottsdale, AZ | $174 | -4.8% | 7.2 |
| 120 | Huntsville, AL | $89 | -5.0% | 9.2 |
| 121 | Amarillo, TX | $74 | -5.0% | 11.4 |
| 122 | Colorado Springs, CO | $109 | -5.0% | 10.8 |
| 123 | Chesapeake, VA | $106 | -5.3% | 6.5 |
| 124 | Fontana, CA | $136 | -5.3% | 3.4 |
| 124 | Irving, TX | $97 | -5.5% | 7.3 |
| 126 | Elk Grove, CA | $147 | -5.6% | 3.7 |
| 127 | Fort Lauderdale, FL | $147 | -5.6% | 3.7 |
| 128 | Jersey City, NJ | $209 | -5.8% | 1.3 |
| 129 | Chattanooga, TN | $93 | -5.9% | 7.8 |
| 130 | Oakland, CA | $197 | -6.0% | 2.4 |
| 131 | Detroit, MI | $141 | -6.2% | 1.1 |
| 132 | Sacramento, CA | $146 | -6.3% | 4.9 |
| 133 | Miami, FL | $173 | -6.3% | 3.5 |
| 134 | Palmdale, CA | $133 | -6.3% | 4.8 |
| 135 | Fayetteville, NC | $112 | -6.4% | 10.7 |
| 136 | Santa Rosa, CA | $180 | -6.4% | 7.5 |
| 137 | Portland, OR | $142 | -6.4% | 4.3 |
| 138 | Stockton, CA | $130 | -6.6% | 6.1 |
| 139 | Newport News, VA | $100 | -7.1% | 6.0 |
| 140 | Ontario, CA | $154 | -7.4% | 2.4 |
| 141 | Henderson, NV | $128 | -7.5% | 5.9 |
| 142 | Washington, DC | $153 | -7.5% | 2.1 |
| 143 | Atlanta, GA | $139 | -7.7% | 4.6 |
| 144 | Las Vegas, NV | $120 | -7.7% | 7.0 |
| 145 | North Las Vegas, NV | $109 | -8.0% | 4.0 |
| 146 | Jacksonville, FL | $112 | -8.5% | 9.5 |
| 147 | Philadelphia, PA | $144 | -8.8% | 2.8 |
| 148 | San Bernardino, CA | $104 | -9.6% | 3.2 |
| 149 | Modesto, CA | $132 | -9.7% | 6.1 |
| 150 | New Orleans, LA | $130 | -16.9% | 4.4 |
Source: StorageCafe analysis of Yardi Matrix data
Buffalo and Tacoma see the highest self storage rent growth, bucking the national trend
Buffalo, New York, emerges as the city with the highest self storage rent growth, with prices going up 7.4% year-over-year. This rate increase to $129/month is closely related to the local dynamics of supply and demand. At 1.8 square feet per person, the local inventory is limited and cannot properly respond to the local need for extra space. Within city limits, about 36K square feet of self storage are scheduled to be delivered in 2023.
The West features the most places with self storage rent hikes among the top 20 cities
Tacoma, Washington, emerges as the city with the second-highest self storage rate growth and is the first western city on our list. Local self storage rates went up 5.8% y-o-y, which translates to street rates of $154/month. This price hike is the direct consequence of local inventory being heavily undersupplied as there are only 4.4 square feet of self storage per capita, considerably below the national benchmark of 7 square feet per person.
Bakersfield, California, is the second Western city to stand out for its self storage rate hikes, which in December 2022 had gone up by 5% compared to the same time the previous year. Street rates in Bakersfield are now $85/month on average.
Even with a healthy inventory that inches close to 5M square feet of self storage – roughly 8.9 square feet/capita – the robust demand keeps rents on a growth trajectory. With a relatively-affordable residential market, Bakersfield is one of the fastest-growing places among California’s biggest cities. It has seen its population go up to almost 400K – an almost 5% increase in 2021 compared to 2020, based on U.S. Census data. With no other major cities in close vicinity to help absorb some of this newly created demand, and in the absence of robust construction activity, rents are poised to experience even more growth.
Moving up to the Central Valley, Fresno is another CA city that registered significant rent growth, standing at 4.1% y-o-y. As a fast-growing area that’s generally more affordable compared to the rest of the state, Fresno has historically seen substantial migration, which has added to local demand for self storage.
As a fast-growing city, Boise, Idaho, continues to see consistent population growth, which rippled across the self storage market as well. Even with a sound 3.8M square feet of total self storage inventory, which translates to over 10 square feet of self storage space per person, street rates shot up 2.6% y-o-y in December 2022. Currently a Boise self storage unit rents for $116/month. Over 490K square feet of self storage space is scheduled for delivery in 2023, which should allow rents to cool down.
Midwestern cities also register self storage price hikes
Aurora, Illinois, is the first Midwestern location on our list, thanks to a 4.6% self storage price increase, bringing street rates up to $97/month. It’s only natural for prices to go up as there are only 2.1 square feet per person, a local inventory that’s unable to fully meet the demands of the market. To respond to the existing demand, about 244K square feet of self storage are scheduled to be added to the local pipeline of the Chicago suburb in 2023.
Nebraska’s Omaha stands out for its self storage rates increase, going up 3.8% y-o-y. This is a direct result of a local inventory that’s not up to par with demand. While the city encompasses an impressive inventory of 4M+ square feet of self storage space, per capita availability boils down to 6.7 square feet per resident, slightly below the national benchmark. Approximately 66K square feet of self storage space is set to be delivered in 2023, targeting the existing local demand.
Indiana’s Fort Wayne has also seen significant rate growth, as self storage rents increased by 3.4% y-o-y, bringing local rates to $100/month. Strong demand fueled by in-migration is partially responsible for this considerable price hike. Moreover, besides the typical residential customers, Fort Wayne also has a lively college scene which generates demand from students attending the local Indiana University–Purdue University Indianapolis. As space always comes at a premium for college students, self storage can, in fact, be a great service, helping them keep seasonal and bulky items during the school year and housing their belongings during the summer break.
Fort Wayne’s self storage inventory currently includes 2.1M square feet of storage space, which boils down to 6.7 square feet of self storage, slightly below the national average. Nearby Columbia City, is also slated to add over 91K square feet of self storage space in 2023, helping to address the local self storage demand in Fort Wayne.
Moving to the South, St. Petersburg, Florida, registers a hefty 4.4% price hike, with monthly rates climbing to $144/month. While the local inventory claims over 2M square feet of self storage space, when it comes to population distribution, locals get about 5.4 square feet of self storage/person. Therefore, to respond to the city’s need for self storage, developers are amping up construction, with close to 140k square feet of self storage space slated for construction in 2023.
Similarly to St. Petersburg, Anchorage, Alaska, also saw self storage rate increases (2.9%), with the local self storage rate hovering around $180/month. Due to the local inventory being slightly undersupplied – 6.2 sq. ft./person – the city is bound to see more self storage construction. In 2023, close to 135K self storage space is set for delivery.
New Orleans, LA, leads the pack of cities with the steepest self storage price plunges
At the other end of the spectrum, it’s New Orleans, Louisiana, that comes first for the steepest street rate drop – 16.9% y-o-y. That brought the cost of a New Orleans storage unit down to $130/month in December 2022 from the $157/month rate of the same time a year prior. Demand may be weakening here as New Orleans has been losing locals in 2021 compared to 2020, to the tune of over 6,000 residents, representing an 1.8% drop in population.
Modesto, California, comes second for street rate reduction (-9.7% y-o-y), bringing the cost of a local storage unit to $132/month. Seen through the lens of self storage availability per capita (6.1 sq. ft./person), the city is a little below national levels and slightly undersupplied.
Rounding out the top three biggest rent decreases list, San Bernadino, California, has seen its self storage rates drop by 9.6%, with a San Bernardino storage unit renting now for $104/month.
While, nationally, self storage rate growth has been curbed due to the current economic climate, more than a third of the 150 largest cities have continued to experience rent spikes that are indicative of the industry’s continuing relevance for people’s needs. Whether it’s incoming migration or an underserved local market, Western and Midwestern cities still see sources of self storage demand fueling the current price hikes. In 2023, self storage will be able to prove its resilience as it adapts to the evolving needs of the market and its customers.
Methodology
This analysis was done by StorageCafe, an online platform that provides storage unit listings across the nation.
The report sets out to investigate which cities registered the most significant spikes in self storage rates year-over-year for a standard 10’x10’ non-climate-controlled unit. To do that, we first selected the 150 largest cities by population based on data from the U.S. Census that also included a minimum of 10 self storage properties.
We ranked these particular cities based on the year-over-year self storage rent change. We compared self storage rents in December 2022 to those in December 2021.
Data on self storage (rates for a 10’x10’ unit, inventory, sq. ft./capita and self storage construction) came from our sister division Yardi Matrix, a business development and asset management tool for brokers, sponsors, banks and equity sources underwriting investments in the multifamily, office, industrial and self-storage sectors.
Fair use and distribution
This study serves as a resource for the general public on issues of common interest and should not be regarded as investment advice. The data is true to the best of our knowledge but may change if amendments to it are made. We agree to the distribution of this content but we do require a mention in return for attribution purposes.


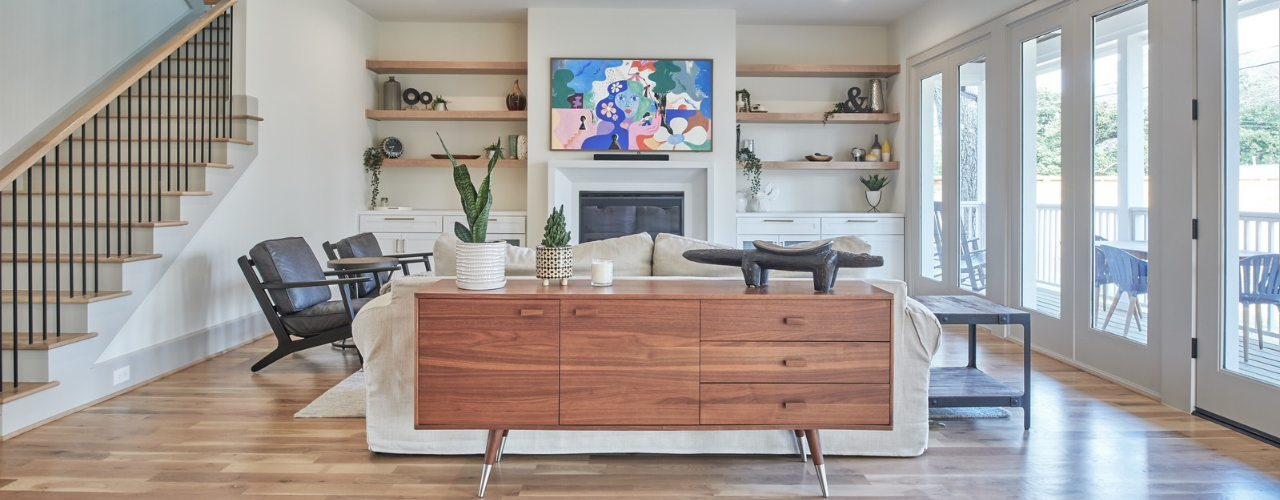
Living Room Storage Ideas: 28 Ways to Reclaim Your Hosting Space
If a living room is where most of a household’s living happens, good storage should be the top priority for setting up or revamping the place. After all, think of how easier it would be to have people over when tidying up the place is just a matter of putting things in their right place (in a time when fewer and fewer people are entertaining friends at home(opens in new tab)). The trick is making room for all those wayward clothes, blankets, chargers and other small things that end up on (or, inexplicably, in) the sofa. Here are 28 living room storage ideas to get you started and make tidying up a quick affair.
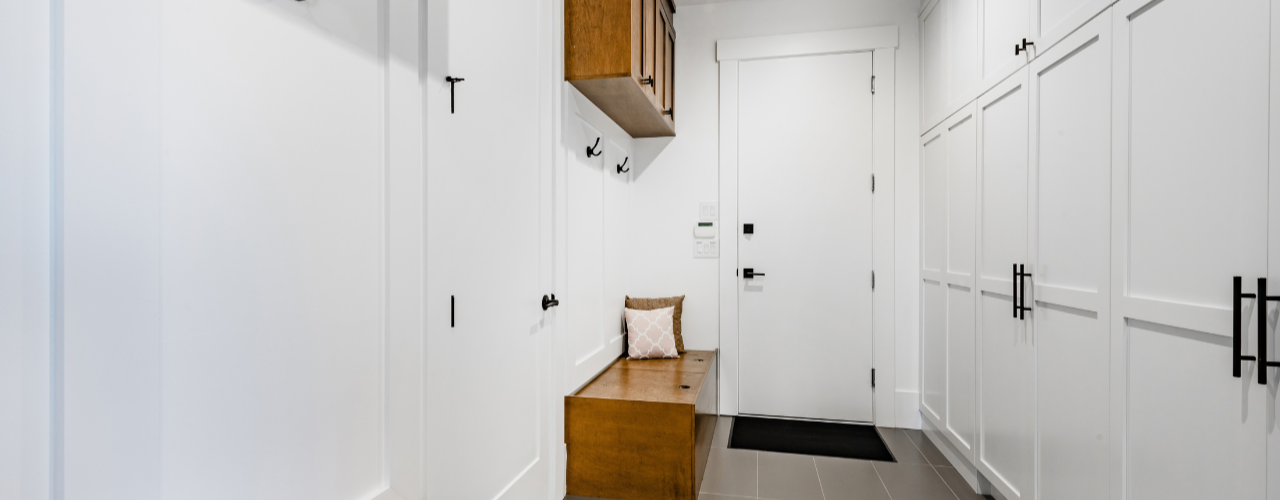
25 Mudroom Storage Ideas (And Mistakes to Avoid)
When you come home with muddy boots, an armful of bags and a coat you can’t wait to take off, it’s nice to have somewhere to put it all. With a mudroom, you can leave the outdoor mess at the door instead of carrying it through the house. Traditionally, you’d set aside a separate room, but you can just as easily use a hallway, an entryway closet, a laundry-room corner or a stretch of wall near the entrance.
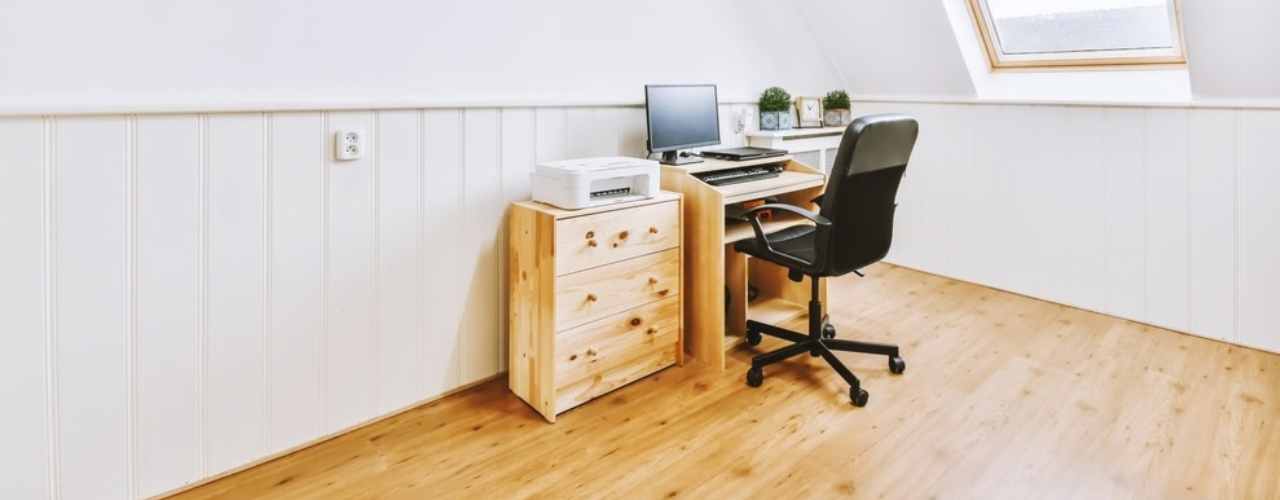
Is Your Home Office Worth the Rent? What Coworking and Self Storage Could Save You
Every square foot of your apartment comes with a price tag, and a home office claims more of them than most renters expect. It starts with a desk. Then come the second monitor, the printer, the filing cabinet and the overflow boxes. Before long, the corner you set aside for work has turned into a small room you are paying for every month.

Best U.S. Cities to Live Uncluttered: Plano, TX, Offers the Most Room to Breathe
Clutter is in our homes as much as in our heads. Both are shaped by where we live.
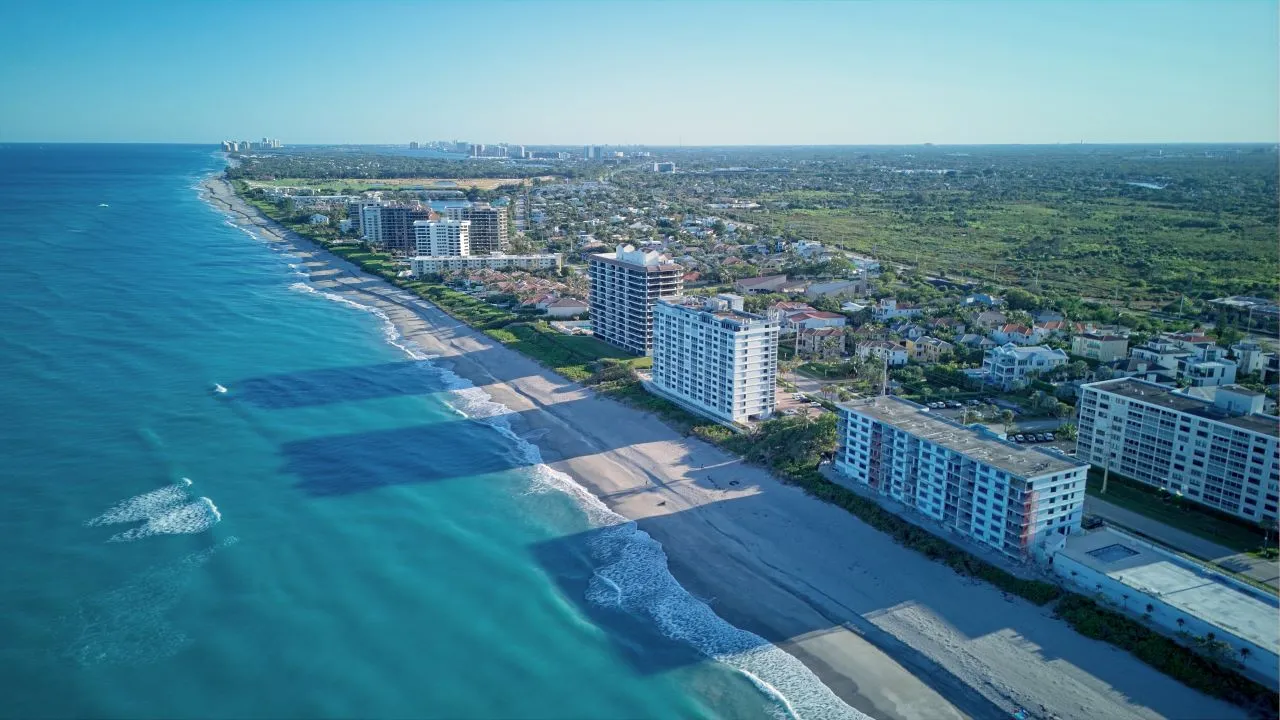
America’s Top Snowbird Destinations for 2026–2027: Florida Leads in Numbers, Texas Wins on Value
For Americans living in colder states, the approach of winter is reason enough to start looking south. Cold weather carries costs that go beyond the heating bill and shoveling snow. Seasonal affective disorder(opens in new tab) is far more prevalent in northern states, so a temporary move south isn’t simply an escape from the cold, but a chance to spend the hardest stretch of winter outdoors and in the sun.
How Much Does Halloween Really Cost in 2026? Plan Wisely to Avoid the Scare of Hidden Costs
Americans’ love for Halloween is almost frightening — this year alone, we are on our way to spending $13.5 billion, according to data from the National Retail Federation(opens in new tab). That breaks down to about $115 Halloween costs per person, a whopping 49% more than 10 years ago.

How to Store LEGOs: All the Fun, None of the Clutter
How to store LEGOs largely comes down to how your household uses them. If the bricks are part of everyday play, you need a setup that keeps them within easy reach and makes cleanup quick (for your feet’s sake, at least). Toy storage(opens in new tab) such as simple bins, playmats or containers that children can put away themselves may be enough. Larger or more serious collections usually need more organization, such as labelled drawers for loose pieces, trays for unfinished builds, shelves for completed models and separate storage for retired sets.

Cardboard Costume Guide: Tips and Ideas for a DIY Halloween
Whether for kids or adults, cardboard costume ideas often make the biggest splash once materialized, and that’s for a simple reason: doing a lot with a little is a universally impressive feat (especially in this economy). If you don’t have enough boxes you could temporarily repurpose, don’t worry! There are many places where you can find free moving boxes(opens in new tab), from stores and supermarkets to online groups and recycling drop-off spots. On the run? Try your luck at a self storage(opens in new tab) facility that sells moving supplies, often for cheap. This way, you can choose moving boxes of different shapes and sizes(opens in new tab), so you can make your costumes as complex as you want.

How to Celebrate Halloween: 9 Non-Spooky Ways To Enjoy It
As soon as October starts, it’s the official Halloween month. And while for many people it means it’s open season to get the scare of a lifetime, others, especially families with small children, might prefer to celebrate in a tamer way that’s both kid- and adult-friendly. While you’re likely to find more events where the spook factor is high, here’s how to celebrate Halloween in a not-so-scary way: