
Despite Rising Home Prices, Indiana And Mid-Atlantic States Step Up With Starter Homes

Key takeaways:
- U.S. homes are getting smaller, with the average size of a new single family home at 2,480 square feet
- Feeder cities in the Washington DC, Indianapolis, Raleigh and Denver metropolitan areas are the best places to start looking for a starter home
- West Palm Beach, FL, and Dayton, OH, saw the most small home sales in recent years
- For a starter home in a larger city, you’ll stand the best chances in Columbus, OH, Indianapolis, IN, Minneapolis/St. Paul, MN and Nashville, TN
Buying your first home is a stepping stone, a long-sought-after objective for many and a way to build equity while starting a new life. How easy is it to buy your first home, though? The simple, honest answer is that it’s not so easy. Unless, perhaps, you’re willing to compromise – primarily on location, as that’s what mostly dictates the affordability and availability of starter homes.
In most big U.S. cities, it’s practically impossible to realize the American dream as a first-time homebuyer, including for millennials, who now make up the largest generational cohort interested in homeownership. There is, however, a silver lining, and that comes with urbanization and the rapid growth of suburbs and feeder cities that can now easily compete with gateway cities in providing premier lifestyles plus access to affordable homes. Moreover, the work-from-home trend has made it even more possible for homebuyers to change places of residence and focus on their living situation rather than stay in a location their job tied them to.
“Housing costs have increased dramatically in both for-sale and for-rent housing, but on a monthly basis, purchasing may still present a better option in specific feeder markets driven by tech and employment growth,” says Doug Ressler, manager of business intelligence at Yardi Matrix. “The difference between the median rent and monthly mortgage payments is the smallest on record. In addition, home equity continues to be the most accessible path to building wealth in the U.S.”
Starter homes might be making a comeback
In response to the growing demand, residential construction has boomed in the last decade, with around 8.5M building permits issued since 2012. Out of these, in 2021 alone, roughly 1.1 million homes have been permitted, the peak year of the past decade for single family development. Also noteworthy, we’re seeing a shift in the size of new builds. After years of going for McMansions, starter homes might be making a comeback as new homes seem to be shrinking.
In fact, homes have been significantly decreasing in size in recent times. The largest homes of the decade — roughly 2,687 square feet — were built in 2015. Since then, sizes have consistently dropped to reach an average of 2,480 for new-builds in 2020. Essentially, single family houses seem to have lost a bit more than a sizeable bedroom – typically 132 sq. ft. – over the last five years or so.
What is considered a starter home today?
Also known as entry-level homes, starter homes are usually smaller and more affordable properties, and as they come with low carrying costs, they are often specifically targeted at first-time homebuyers. Definitions do differ, but there is a general consensus around the idea that a starter home is usually 1,700 square feet or less, generally has 2 bedrooms, and is listed for less than the local median price.
Read more
Fixer-uppers are often considered to be great candidates for starter homes, as they tend to be more affordable properties that need work and repairs.
Starter homes do indeed feature less space than ‘forever homes,’ but in today’s housing market the compromise on size is actually one that is easier to deal with since self storage has never been more available. There’s storage space virtually around every corner as the industry has been booming in recent times and the service is generally inexpensive — $128 per month on average for a standard 10’x10’ unit.
First-time buyers head east: Indiana, Maryland and Ohio cities emerge as hotspots for starter homes
The first-time homebuyer market is growing, with 34% of last year’s buyer pool being made up of people who bought their first home, up from 31% in 2020. The majority of those first-time buyers went for homes under 2,000 square feet, as opposed to repeat buyers, who favored larger, 2,000+ square-foot abodes.
The typical U.S. home is now valued at $344,141, up 20.9% over the past year, which combined with bidding wars and limited supply, gives homebuyers a real run for their money. Naturally, things do differ depending on where you are willing to live, and some places can make it easier than others to find a good starter home. So, what are the best places for first-time homebuyers?
By looking at over 100 U.S. cities and ranking them across more than 20 factors including home values for 2-bedroom homes, 5-year sales activity involving properties averaging 1,700 square feet or less, mortgage rates, incomes and cost of living, we were able to determine the best areas and cities for first-time homebuyers. In other words, we’re giving you the starter home champions – the cities that, against all odds, still provide opportunities for young people looking to put one foot up the property ladder.
First-time homebuyers have particularly good options in Indiana. A combination of factors, including low unemployment, affordable cost of living and low median home prices ($113K) make Fort Wayne, IN, stand out as the city offering homebuyers the best opportunity to land a starter home. In fact, the majority of homebuyers here in 2019 were millennials, drawn to the city by the great, family-oriented setting, low costs and an expanding job market.
Fishers and Carmel add to the Indiana list of great places for first-time homebuyers. These two Indianapolis ‘feeder’ cities came in at number four and six, respectively, reinforcing the idea that suburbs best cater to current lifestyle needs. They both have large single-family home markets, with 81% owner-occupied homes and home values ranging around $259K in Fishers and $286K in Carmel for 2-bedroom properties. With low costs of living and discretionary incomes hovering around $53K and $61K respectively, both Fishers and Carmel make excellent candidates for starter home searches. Moreover, self storage in Fishers, for example, is very affordable, with street rates around $93 per month.
Millennials also represented the majority of homebuyers in Columbia, MD, which came in at number two in our ranking. Young professionals can easily take advantage of the healthy housing sector here, where a typical 2-bedroom home is valued at a reasonable $264,055. Annual discretionary incomes hover around $48K, which puts locals in a good spot to enjoy comfortable living. Moreover, it takes less than a year to save up for a downpayment in Columbia.
The affordability of Pittsburgh, PA, our third spot, may not be quite what it used to be, but the city still provides a great bang for the buck. Median home values – currently $170,042 – are among the lowest in the nation, giving potential homebuyers plenty of room to wiggle. In fact, among the 100 cities we analyzed, Pittsburgh has the 6th most active starter home sales market based on the number of sales completed in the last five years.
The capital of Ohio, Columbus, is the largest city to make our ranking, as the city’s population draws closer and closer to the 1M mark. Columbus is not an owner-dominated market yet, as only 46% are homeowners, unemployment is reasonably low and median home values do not exceed $165K. What’s more, seeing that the cost of living is well below the national average, it is no wonder that the majority of homebuyers in Columbus in 2019 were millennials.

Cary, NC, can also easily respond to current homebuyers needs as the healthy local economy allows for comfortable living. At $43,885, discretionary incomes are among the highest in the country, and median home prices hover around $308,611. Generally appreciated for its well-manicured streets and safe residential communities, Cary boasts a large homeowner market, with 71% of the local inventory being made up of owner-occupied housing units and good self storage opportunities. Nearby Raleigh comes in at no. 18, confirming the impression that North Carolina’s Research Triangle is a place where people can more easily start out as homeowners.
Minnesota’s Twin Cities are two big names that made it to the front of the list. Traditionally cheaper than their more hyped counterparts on the coasts, they still provide good chances for those who want to enter homeownership. These two cities have a median homebuyer age of 40 years, considerably low unemployment rates (not exceeding 6.5%) and affordable median home values (ranging from $244K in St. Paul to $288K in Minneapolis). In 2019, the majority of homebuyers in these cities were millennials, drawn to these markets due to a cost of living that is significantly lower than that of other big U.S. cities and thanks to median household incomes that hover around $60-70K.
Finally, Manchester, NH, which made it to number 9 on our list, is a city that is more and more frequently recognized as a good place for homebuyers. Besides the absence of state income taxes and sales taxes in the state of New Hampshire and the one-hour commute to Boston, unemployment has stayed below 7%, median home values hover around $275K and the average mortgage rate is 3.03%.
Denver's feeder cities and Bakersfield, CA, are the only viable options to the west
Of the 20 California cities we looked at, Millennials are majority buyers in only three – Bakersfield, Modesto and Fremont. The rest, including San Francisco, LA and San Diego, mostly appeal to Gen Xers and baby boomers.
The country’s West Coast may not offer the best opportunities for young buyers looking to own property, but for those people who are not willing to give up on the Golden State’s vibe and lifestyle, Bakersfield, CA, is a good spot for starter homes. The city made it to number 12 in our ranking mostly thanks to good mortgage rates, median home values that hover around $216K for 2-bed homes and a surprisingly affordable cost of living compared to other California hotspots. In a nutshell, it will take Bakersfield residents only about 3 years to save up for a downpayment.
Colorado also presents a few viable options out west, since no less than three different cities in the Denver metropolitan area, along with the city proper, made it to the top 20. Arvada and Centennial came in at number 13 and number 15, respectively. Their median property values are lower than in Denver itself, at $470K in Arvada and $440K in Centennial — this is compared to $500K in the state’s capital, which landed in 16th place. However, the cost of living is actually slightly lower in Denver, and more starter homes were sold here between 2015 and 2021 as a proportion of local population, compared to the two nearby cities.
Millennials also represented the majority of homebuyers in Lakewood, another important part of the metro area, which closed off our top 20 ranking.

Florida and Ohio cities have most active starter home markets per their populations
According to our research, the largest number of starter homes sold, as a proportion of the local population, occurred in several cities in Ohio and Florida. West Palm Beach, FL, and Dayton, OH, saw more than 350 and 300 starter homes sold, respectively, per 1,000 residents over the period 2015-2021. Boca Raton, FL, is not far behind with 256 properties and Cincinnati — the biggest city among these with a population of around 300K — witnessed 222 starter homes change hands per every 1,000 residents.
Finding your ideal starter home – a case of “Where’s Waldo?”
It is often said that looking for a starter home now is like searching for a needle in a haystack. There is so much talk regarding the unavailability and unaffordability of starter homes, but that doesn’t mean they are extinct – you just have to know where to look. We choose to see the glass half full.
Forced by skyrocketing prices, fluid job security and increased mobility opportunities, young people have started to show a remarkable willingness to relocate. And millennials in fact represent the majority of homebuyers in no less than 11 of the top 20 cities. They should continue to capitalize on smaller emerging markets when looking for a starter home. Moving inland clearly tends to improve the best chances of getting a starter home. But more than that, it’s feeder cities and suburbs that give first-time homebuyers a real chance at owning property. With growing economies and laden with amenities, these smaller cities now vie with the hyped urban hotspots at attracting and retaining residents. Both during the relocating process and afterwards, especially if you choose to downsize in the process, self storage can be a life saver.
Most of the cities we mentioned are already in the process of experiencing a revival and could continue to thrive as they foster numerous advantages of all kinds for millennials and others, including various and consistent employment opportunities. Ultimately, what is the city but the people?
Check out the complete list of all 108 U.S. cities in our analysis here:
108 U.S. Cities Ranked for Starter Homes
* Starter homes are considered to be properties under 1,700 sq. ft.; no. of sales are per 1,000 of the population.
| Rank Index | City | State | Median Property Value | Sales of Starter Homes /1000* | Housing Affordability Index | Cost of Living Index | Homebuyers' Age | Unemployment Rate | Renters | Owners | Average Mortgage Rate | FHA Mortgage Lending Limits - Single House Limits(Average) | Necessity Total Cost From Income | Self Storage Inventory (Sq. Ft./ Capita) | Street Rates | Population Density per Sq. Mile (2019) |
|---|---|---|---|---|---|---|---|---|---|---|---|---|---|---|---|---|
| 1 | Fort Wayne | Indiana | $113,144 | 105 | 373 | 87 | 35 | 7% | 35% | 65% | 3.14% | $420,680 | 79% | 8 | $92 | 2,394 |
| 2 | Columbia | Maryland | $264,055 | 46 | 251 | 106 | 39 | 7% | 32% | 68% | 3.00% | $585,444 | 42% | 5 | $158 | 3,230 |
| 3 | Pittsburgh | Pennsylvania | $170,042 | 172 | 369 | 104 | 38 | 9% | 49% | 51% | 3.03% | $433,112 | 74% | 10 | $116 | 5,495 |
| 4 | Fishers | Indiana | $258,679 | 16 | 305 | 92 | 38 | 7% | 19% | 81% | 3.14% | $420,680 | 40% | 9 | $95 | 2,657 |
| 5 | Columbus | Ohio | $164,229 | 87 | 336 | 92 | 39 | 7% | 54% | 46% | 3.16% | $422,796 | 77% | 6 | $91 | 4,049 |
| 6 | Carmel | Indiana | $244,670 | 110 | 314 | 104 | 40 | 6% | 47% | 53% | 3.01% | $424,837 | 79% | 2 | $153 | 5,857 |
| 7 | St. Paul | Indiana | $286,151 | 8 | 312 | 92 | 38 | 7% | 19% | 81% | 3.14% | $420,680 | 38% | 5 | $125 | 2,074 |
| 8 | Cary | North Carolina | $308,611 | 1 | 299 | 94 | 43 | 6% | 29% | 71% | 3.02% | $435,806 | 48% | 7 | $101 | 3,079 |
| 8 | Manchester | New Hampshire | $276,257 | 76 | 283 | 111 | 40 | 7% | 55% | 45% | 3.03% | $491,586 | 72% | 6 | $130 | 3,397 |
| 10 | Minneapolis | Minnesota | $288,926 | 39 | 328 | 105 | 40 | 6% | 50% | 50% | 3.01% | $424,837 | 71% | 4 | $111 | 7,784 |
| 11 | Nashville | Tennessee | $318,046 | 63 | 257 | 93 | 39 | 7% | 44% | 56% | 3.02% | $458,164 | 75% | 6 | $121 | 1,397 |
| 12 | Bakersfield | California | $216,063 | 0 | 260 | 102 | 40 | 13% | 40% | 60% | 3.04% | $608,863 | 59% | 13 | $79 | 2,661 |
| 13 | Arvada | Colorado | $476,672 | 90 | 211 | 114 | 39 | 8% | 23% | 77% | 3.00% | $519,362 | 52% | 8 | $145 | 3,393 |
| 14 | Alexandria | Virginia | $432,703 | 56 | 268 | 137 | 40 | 7% | 58% | 42% | 2.99% | $519,693 | 50% | 11 | $192 | 10,508 |
| 15 | Centennial | Colorado | $444,747 | 65 | 184 | 114 | 39 | 8% | 17% | 83% | 3.00% | $519,362 | 44% | 7 | $116 | 3,801 |
| 16 | Denver | Colorado | $505,777 | 119 | 240 | 113 | 39 | 8% | 46% | 54% | 3.00% | $519,362 | 67% | 7 | $128 | 4,612 |
| 17 | Raleigh | North Carolina | $279,304 | 2 | 291 | 94 | 43 | 6% | 46% | 54% | 3.02% | $435,806 | 74% | 10 | $93 | 3,248 |
| 18 | Germantown | Maryland | $261,511 | 30 | 223 | 157 | 39 | 7% | 36% | 64% | 3.00% | $585,444 | 52% | 3 | $173 | 5,186 |
| 19 | St. Petersburg | Florida | $283,684 | 140 | 255 | 96 | 53 | 7% | 37% | 63% | 3.11% | $433,655 | 72% | 2 | $166 | 4,215 |
| 20 | Lakewood | Colorado | $380,165 | 79 | 211 | 114 | 39 | 8% | 40% | 60% | 3.00% | $519,362 | 68% | 9 | $124 | 3,608 |
| 21 | Aurora | Colorado | $360,542 | 115 | 206 | 114 | 39 | 8% | 40% | 60% | 3.00% | $519,362 | 71% | 8 | $116 | 2,381 |
| 22 | Boca Raton | Florida | $280,104 | 256 | 190 | 116 | 51 | 8% | 28% | 72% | 3.11% | $433,655 | 54% | 15 | $163 | 3,361 |
| 23 | Modesto | California | $319,328 | 64 | 238 | 119 | 39 | 11% | 45% | 55% | 3.04% | $608,863 | 64% | 10 | $141 | 5,746 |
| 24 | Chandler | Arizona | $388,450 | 71 | 252 | 103 | 51 | 7% | 33% | 67% | 3.12% | $423,637 | 58% | 8 | $141 | 3,948 |
| 25 | Las Vegas | Nevada | $265,170 | 175 | 237 | 107 | 50 | 15% | 46% | 54% | 3.11% | $444,476 | 69% | 20 | $128 | 4,667 |
| 26 | Washington | District of Columbia | $623,135 | 76 | 288 | 157 | 40 | 7% | 57% | 43% | 4.90% | $970,800 | 57% | 3 | $170 | 11,484 |
| 27 | Scottsdale | Arizona | $478,609 | 107 | 221 | 103 | 51 | 7% | 32% | 68% | 3.12% | $423,637 | 55% | 10 | $184 | 1,362 |
| 28 | Spokane | Washington | $300,881 | 58 | 298 | 107 | 44 | 9% | 42% | 58% | 3.06% | $477,475 | 74% | 12 | $120 | 3,684 |
| 29 | Peoria | Arizona | $373,588 | 74 | 228 | 103 | 51 | 7% | 24% | 76% | 3.12% | $423,637 | 65% | 10 | $125 | 967 |
| 30 | Gilbert | Arizona | $409,324 | 56 | 224 | 103 | 51 | 7% | 25% | 75% | 3.12% | $423,637 | 50% | 8 | $125 | 3,577 |
| 31 | Portland | Oregon | $484,475 | 125 | 241 | 132 | 44 | 8% | 47% | 53% | 3.08% | $598,000 | 67% | 7 | $150 | 4,874 |
| 32 | Surprise | Arizona | $408,075 | 96 | 211 | 95 | 51 | 7% | 25% | 75% | 3.12% | $423,637 | 70% | 11 | $119 | 1,278 |
| 33 | Tacoma | Washington | $395,252 | 133 | 259 | 150 | 40 | 8% | 43% | 57% | 3.06% | $477,475 | 74% | 11 | $144 | 4,257 |
| 34 | Sacramento | California | $417,753 | 115 | 242 | 122 | 43 | 9% | 50% | 50% | 3.04% | $608,863 | 72% | 12 | $155 | 5,112 |
| 35 | Westminster | Colorado | $407,976 | 5 | 208 | 109 | 39 | 8% | 32% | 68% | 3.00% | $519,362 | 63% | 5 | $135 | 3,530 |
| 36 | Henderson | Nevada | $358,778 | 69 | 221 | 107 | 50 | 15% | 34% | 66% | 3.11% | $444,476 | 54% | 10 | $137 | 2,779 |
| 36 | Quincy | Massachusetts | $493,694 | 40 | 246 | 150 | 40 | 9% | 47% | 53% | 2.97% | $650,768 | 62% | 5 | $169 | 5,542 |
| 38 | Stockton | California | $314,905 | 41 | 232 | 114 | 48 | 11% | 51% | 49% | 3.04% | $608,863 | 67% | 7 | $133 | 4,988 |
| 39 | Coral Springs | Florida | $169,808 | 8 | 200 | 116 | 51 | 8% | 40% | 60% | 3.11% | $433,655 | 59% | 4 | $166 | 5,524 |
| 40 | Davie | Florida | $219,181 | 26 | 191 | 116 | 51 | 8% | 34% | 66% | 3.11% | $433,655 | 61% | 13 | $156 | 2,983 |
| 41 | North Las Vegas | Nevada | $286,248 | 63 | 214 | 107 | 50 | 15% | 41% | 59% | 3.11% | $444,476 | 66% | 9 | $124 | 2,390 |
| 42 | Elk Grove | California | $449,589 | 37 | 187 | 122 | 43 | 9% | 25% | 75% | 3.04% | $608,863 | 46% | 6 | $156 | 4,067 |
| 43 | Atlanta | Georgia | $392,110 | 4 | 315 | 106 | 43 | 7% | 54% | 46% | 3.06% | $431,682 | 74% | 11 | $151 | 3,675 |
| 44 | Spokane Valley | Washington | $336,846 | 9 | 265 | 107 | 44 | 9% | 41% | 59% | 3.06% | $477,475 | 69% | 14 | $112 | 2,567 |
| 45 | Santa Clarita | California | $482,433 | 68 | 175 | 148 | 42 | 12% | 30% | 70% | 3.04% | $608,863 | 46% | 4 | $189 | 4,027 |
| 46 | Fremont | California | $746,571 | 44 | 177 | 191 | 37 | 8% | 39% | 61% | 3.04% | $608,863 | 47% | 5 | $169 | 3,062 |
| 47 | San Francisco | California | $1,458,379 | 35 | 265 | 187 | 40 | 8% | 56% | 44% | 3.04% | $608,863 | 56% | 3 | $269 | 18,616 |
| 48 | Beaverton | Oregon | $366,659 | 11 | 246 | 132 | 44 | 8% | 50% | 50% | 3.08% | $598,000 | 63% | 13 | $154 | 5,151 |
| 49 | Plantation | Florida | $226,845 | 27 | 186 | 116 | 51 | 8% | 35% | 65% | 3.11% | $433,655 | 60% | 6 | $185 | 4,248 |
| 50 | Pembroke Pines | Florida | $215,429 | 36 | 185 | 116 | 51 | 8% | 28% | 72% | 3.11% | $433,655 | 66% | 6 | $191 | 5,154 |
| 51 | Stamford | Connecticut | $428,272 | 32 | 228 | 139 | 43 | 8% | 47% | 53% | 3.08% | $451,243 | 53% | 8 | $197 | 3,403 |
| 52 | Hillsboro | Oregon | $389,436 | 2 | 239 | 132 | 44 | 8% | 47% | 53% | 3.08% | $598,000 | 57% | 9 | $140 | 4,439 |
| 52 | Salem | Oregon | $320,201 | 3 | 256 | 102 | 55 | 7% | 45% | 55% | 3.08% | $420,680 | 74% | 11 | $133 | 3,520 |
| 54 | Chicago | Illinois | $294,231 | 2 | 304 | 123 | 40 | 10% | 51% | 49% | 3.04% | $420,680 | 73% | 4 | $133 | 11,884 |
| 55 | Fort Lauderdale | Florida | $406,233 | 80 | 216 | 119 | 51 | 8% | 48% | 52% | 3.11% | $433,655 | 71% | 14 | $159 | 5,146 |
| 56 | Boston | Massachusetts | $712,290 | 16 | 251 | 150 | 40 | 9% | 63% | 37% | 2.97% | $650,768 | 65% | 1 | $190 | 14,258 |
| 57 | Miramar | Florida | $296,870 | 30 | 186 | 116 | 51 | 8% | 28% | 72% | 3.11% | $433,655 | 65% | 5 | $233 | 4,649 |
| 58 | Irvine | California | $772,037 | 32 | 198 | 148 | 42 | 12% | 51% | 49% | 3.04% | $608,863 | 43% | 11 | $165 | 4,139 |
| 59 | Huntington Beach | California | $721,058 | 41 | 173 | 148 | 42 | 12% | 44% | 56% | 3.04% | $608,863 | 48% | 6 | $180 | 7,417 |
| 60 | Chula Vista | California | $530,945 | 39 | 181 | 145 | 45 | 9% | 39% | 61% | 3.04% | $608,863 | 58% | 7 | $184 | 5,378 |
| 61 | San Diego | California | $685,055 | 51 | 192 | 148 | 45 | 9% | 51% | 49% | 3.04% | $608,863 | 60% | 4 | $181 | 4,337 |
| 62 | Oceanside | California | $512,203 | 65 | 157 | 145 | 45 | 9% | 44% | 56% | 3.04% | $608,863 | 66% | 5 | $171 | 4,283 |
| 63 | Long Beach | California | $652,663 | 47 | 218 | 148 | 42 | 12% | 58% | 42% | 3.04% | $608,863 | 70% | 5 | $192 | 9,336 |
| 64 | Garden Grove | California | $558,793 | 37 | 148 | 148 | 42 | 12% | 47% | 53% | 3.04% | $608,863 | 63% | 2 | $127 | 9,625 |
| 65 | Anaheim | California | $597,778 | 32 | 163 | 151 | 42 | 12% | 55% | 45% | 3.04% | $608,863 | 61% | 4 | $196 | 6,999 |
| 66 | Yonkers | New York | $538,306 | 14 | 251 | 148 | 41 | 10% | 52% | 48% | 3.05% | $509,409 | 71% | 4 | $232 | 11,109 |
| 66 | Santa Ana | California | $555,815 | 26 | 143 | 148 | 42 | 12% | 54% | 46% | 3.04% | $608,863 | 65% | 4 | $182 | 12,326 |
| 68 | Glendale | California | $834,246 | 31 | 215 | 148 | 42 | 12% | 64% | 36% | 3.04% | $608,863 | 66% | 2 | $254 | 6,674 |
| 69 | Los Angeles | California | $785,014 | 31 | 192 | 148 | 42 | 12% | 60% | 40% | 3.04% | $608,863 | 72% | 2 | $256 | 8,458 |
| 70 | Bend | Oregon | $642,834 | 8 | 199 | 124 | 55 | 8% | 40% | 60% | 3.08% | $569,250 | 72% | 12 | $147 | 2,886 |
| 71 | Indianapolis | Indiana | $138,590 | 117 | 332 | 92 | 38 | 7% | 44% | 56% | 3.14% | $420,680 | 86% | 8 | $87 | 2,395 |
| 72 | Cincinnati | Ohio | $173,874 | 222 | 428 | 93 | 39 | 7% | 59% | 41% | 3.16% | $422,796 | 97% | 12 | $98 | 3,864 |
| 73 | Dayton | Ohio | $69,253 | 300 | 441 | 92 | 41 | 8% | 52% | 48% | 3.16% | $422,796 | 102% | 10 | $80 | 2,510 |
| 73 | Jacksonville | Florida | $172,550 | 86 | 270 | 93 | 43 | 6% | 42% | 58% | 3.11% | $433,655 | 78% | 10 | $118 | 1,192 |
| 75 | Rochester | New York | $123,882 | 60 | 405 | 101 | 36 | 8% | 62% | 38% | 3.05% | $509,409 | 124% | 8 | $123 | 5,746 |
| 76 | Tallahassee | Florida | $138,217 | 93 | 289 | 97 | 46 | 6% | 60% | 40% | 3.11% | $433,655 | 102% | 13 | $105 | 1,913 |
| 77 | Gainesville | Florida | $159,888 | 124 | 308 | 111 | 51 | 5% | 60% | 40% | 3.11% | $433,655 | 118% | 11 | $103 | 2,166 |
| 78 | Richmond | Virginia | $224,635 | 22 | 290 | 97 | 40 | 7% | 58% | 42% | 2.99% | $519,693 | 91% | 17 | $108 | 3,777 |
| 79 | Buffalo | New York | $164,750 | 38 | 409 | 94 | 35 | 10% | 58% | 42% | 3.05% | $509,409 | 100% | 4 | $118 | 6,412 |
| 80 | Milwaukee | Wisconsin | $147,508 | 9 | 353 | 100 | 38 | 7% | 57% | 43% | 3.04% | $421,453 | 102% | 5 | $99 | 6,193 |
| 81 | Baltimore | Maryland | $189,943 | 1 | 324 | 106 | 39 | 7% | 50% | 50% | 3.00% | $585,444 | 89% | 6 | $126 | 7,519 |
| 82 | Tampa | Florida | $272,904 | 132 | 264 | 94 | 53 | 7% | 49% | 51% | 3.11% | $433,655 | 79% | 17 | $119 | 3,433 |
| 83 | Waterbury | Connecticut | $140,695 | 47 | 349 | 119 | 39 | 7% | 56% | 44% | 3.08% | $451,243 | 106% | 3 | $135 | 3,734 |
| 84 | Clearwater | Florida | $253,422 | 138 | 248 | 96 | 53 | 7% | 43% | 57% | 3.11% | $433,655 | 87% | 14 | $132 | 4,429 |
| 85 | Albany | New York | $206,959 | 40 | 345 | 108 | 44 | 7% | 60% | 40% | 3.05% | $509,409 | 103% | 7 | $116 | 4,642 |
| 86 | Hartford | Connecticut | $141,225 | 23 | 301 | 110 | 39 | 8% | 73% | 27% | 3.08% | $451,243 | 117% | 1 | $78 | 7,240 |
| 87 | Allentown | Pennsylvania | $193,234 | 88 | 288 | 104 | 44 | 9% | 59% | 41% | 3.03% | $433,112 | 119% | 5 | $127 | 6,718 |
| 88 | New Bedford | Massachusetts | $310,451 | 46 | 334 | 117 | 40 | 10% | 57% | 43% | 2.97% | $650,768 | 86% | 5 | $122 | 4,762 |
| 89 | Glendale | Arizona | $245,632 | 75 | 256 | 103 | 51 | 7% | 43% | 57% | 3.12% | $423,637 | 87% | 9 | $118 | 4,130 |
| 90 | Tucson | Arizona | $239,555 | 85 | 292 | 105 | 50 | 8% | 47% | 53% | 3.12% | $423,637 | 98% | 11 | $116 | 2,385 |
| 91 | Mesa | Arizona | $306,285 | 81 | 242 | 103 | 51 | 7% | 39% | 61% | 3.12% | $423,637 | 81% | 10 | $111 | 3,674 |
| 92 | Providence | Rhode Island | $300,137 | 65 | 307 | 117 | 41 | 10% | 61% | 39% | 3.03% | $592,250 | 86% | 3 | $132 | 9,972 |
| 93 | West Palm Beach | Florida | $246,106 | 350 | 216 | 116 | 51 | 8% | 53% | 47% | 3.11% | $433,655 | 84% | 28 | $140 | 1,996 |
| 94 | Brockton | Massachusetts | $333,263 | 66 | 254 | 150 | 40 | 9% | 39% | 61% | 2.97% | $650,768 | 80% | 3 | $128 | 4,552 |
| 95 | New Haven | Connecticut | $294,204 | 50 | 265 | 150 | 40 | 9% | 54% | 46% | 2.97% | $650,768 | 80% | 1 | $162 | 7,950 |
| 96 | Lowell | Massachusetts | $204,597 | 13 | 296 | 118 | 38 | 7% | 70% | 30% | 3.08% | $451,243 | 111% | 3 | $152 | 6,860 |
| 97 | Phoenix | Arizona | $309,461 | 73 | 250 | 104 | 51 | 7% | 44% | 56% | 3.12% | $423,637 | 82% | 6 | $128 | 3,159 |
| 98 | Tempe | Arizona | $325,228 | 61 | 257 | 103 | 51 | 7% | 59% | 41% | 3.12% | $423,637 | 81% | 10 | $127 | 4,686 |
| 99 | Gresham | Oregon | $324,201 | 77 | 227 | 132 | 44 | 8% | 45% | 55% | 3.08% | $598,000 | 84% | 6 | $158 | 4,707 |
| 100 | Detroit | Michigan | $53,147 | 1 | 403 | 104 | 41 | 12% | 51% | 49% | 3.16% | $420,680 | 127% | 2 | $154 | 4,855 |
| 101 | Bridgeport | Connecticut | $227,202 | 35 | 278 | 137 | 43 | 8% | 56% | 44% | 3.08% | $451,243 | 108% | 3 | $142 | 9,102 |
| 102 | Lynn | Massachusetts | $417,757 | 58 | 237 | 150 | 40 | 9% | 51% | 49% | 2.97% | $650,768 | 81% | 2 | $147 | 8,522 |
| 103 | Cape Coral | Florida | $254,583 | 26 | 205 | 103 | 57 | 7% | 27% | 73% | 3.11% | $433,655 | 76% | 8 | $162 | 1,735 |
| 104 | Sunrise | Florida | $165,521 | 52 | 185 | 116 | 51 | 8% | 35% | 65% | 3.11% | $433,655 | 83% | 3 | $183 | 5,226 |
| 105 | Pompano Beach | Florida | $277,754 | 57 | 210 | 119 | 51 | 8% | 51% | 49% | 3.11% | $433,655 | 87% | 18 | $174 | 4,586 |
| 106 | Hollywood | Florida | $334,643 | 63 | 209 | 116 | 51 | 8% | 41% | 59% | 3.11% | $433,655 | 84% | 6 | $199 | 5,649 |
| 107 | Oakland | California | $799,605 | 45 | 243 | 150 | 40 | 8% | 57% | 43% | 3.04% | $608,863 | 84% | 3 | $210 | 7,591 |
| 108 | New York | New York | $744,654 | 20 | 245 | 241 | 41 | 10% | 64% | 36% | 3.05% | $509,409 | 74% | 2 | $388 | 27,787 |
What the experts say
Mark Stapp, Executive Director, MRED/Fred E. Taylor Professor in Real Estate, W. P. Carey School of Business, Arizona State University
What’s the status of the starter home market right now? Would you say the current housing landscape is beneficial for first-time homebuyers?
This market is difficult for first time homebuyers of all levels but especially difficult for buyers of median priced and below homes because the inventory is historically very low and competition very high. First time buyers are also facing decreasing affordability — interest rates rising means they can afford less and sometimes that happens in the midst of a search when interest rates rise - all of a sudden you need to reduce what you can afford. If you have substantial income(s) and sufficient cash for down payment you can compete for homes but without these two things it is very difficult. Many times buyers are faced with either continuing to rent or making trade-off’s of location, size or quality — driving further, buying a smaller home or buying a different type of house, e.g. townhomes versus a single family detached or buying older homes that may need renovation.
Read more....
Has the work-from-home trend affected the homebuying market? And if it did, in what way?
Yes, on the margins of the market, but it has had an impact especially when coupled with other trends and conditions. Employment growth drives population growth and population growth drives housing demand. WFA (“work from anywhere”) disrupted this by allowing employment and living to be in totally disconnected places. It allowed buyers to buy in markets already tight on inventory and compete for those who needed to live in a community where they worked — need versus want — and both create demand. It also allowed some to stay in their homes and renovate rather than move, thus keeping homes off the market. In some places it shifted the market dynamics and in an already tight market that small shift can have an impact especially when coupled with other trends.
Do you think the rising housing inventory will mean more people will be able to get starter homes?
Not for a while because of cost increases in land, labor and capital — cost and scarcity of suitable land, labor shortages and materials cost increases and rising interest rates will dampen demand, slow price increases (but they will continue) and allow builders to move toward normalized production and absorption rates, but this will take 18 to 24 months. This scenario is dependent on global political and economic factors that are hard to predict right now.
Jia Xie, Assistant Professor of Finance, California State University, Fullerton
What’s the status of the starter home market right now? Would you say the current housing landscape is beneficial for first-time homebuyers?
Starter homes are in very low supply. Developers are building fewer starter homes nowadays than decades ago. Owners of starter homes don’t want to sell their starter homes, because most of them have refinanced for low mortgage rates during the pandemic and they won’t be able to get the low rates after they sell their homes.
The current market is not beneficial at all for first-time homebuyers. On one hand, the supply of starter homes is very low, so first-time homebuyers have very limited choices. On the other hand, the soaring mortgage rates limit how much first-time homebuyers can afford. First-time homebuyers have to be more patient and search longer to get into the housing market.
Read more....
Has the work-from-home trend affected the homebuying market? And if it did, in what way?
Yes, for sure. It has changed buyers’ preferences on houses. As people are staying for a longer time at home, home size has more priority than proximity to work. Young buyers also prefer communities with nice landscaping and amenities like pools and parks. So we have seen a lot of transactions in remote communities of single family houses with nice landscaping and amenities.
Bart McLeroy, MS, MBA, Professor of Real Estate, Collin College
What’s the status of the starter home market right now? Would you say the current housing landscape is beneficial for first-time homebuyers?
Rather than just give anecdotal evidence, I pulled MLS data from a portion of the DFW metro area bounded by US 380, US 75, SH 121, and the Dallas North Tollway. This is one of the fastest-growing areas in the state of Texas. Between January 1, 2020 and April 19, 2022, approximately 35% of the homes sold in that area were what I would categorize as starter homes, with no more than 3 bedrooms and 2.1 baths. The average single-family starter home in that cohort (of 308 sales) was built in 2004. Only 90 were built in 2010 or later.
It's no secret that new home construction during the pandemic slowed down for a variety of reasons. In this area, only 5 single-family starter homes have been built since 2020. The price range of these homes was $343,000 to $399,000, which is well outside of the traditional price range for starter homes in this area. This means that in one of the fastest-growing parts of the state, builders are not building starter homes, at least that are designed for sale to owner-occupants. Those starter homes being built in other parts of the DFW metro area are typically "build-to-rent" units.
Aging inventory and rapidly increasing prices are as far from beneficial conditions as you can get for first-time homebuyers.
Read more....
Has the work-from-home trend affected the homebuying market? And if it did, in what way?
I'm seeing a preference for more indoor space, especially space that can be used flexibly for workspace or remote learning during the day, and for recreation at other times.
Do you think the rising housing inventory will mean more people will be able to get starter homes?
If builders aren't building starter homes in an area, especially those designed for purchase by owner-occupants, the aging inventory of existing starter homes means that more buyers will continue to be shut out of the real estate market.
Builders are focusing their efforts on larger, higher-end properties that will provide them with better returns. A major factor is the cost of land. For the most expensive of the new starter homes mentioned earlier, the county appraisal district has assessed the value of the underlying land at $148,500. The assessed land value of the lowest-price home is $120,000. With values like this you’re simply not going to see homes in this area in the ballpark of $250,000 that the typical starter home buyer is looking for.
Even before the rapid price appreciation in the last 2 years, the average wage-earner in the DFW metro area could not afford the average priced home. Existing inventory coming to market is not going to make a dent in this trend. The value of these properties has gone up, and pending a major calamity, is not going down in a meaningful way any time soon.
The best strategy I have seen lately for the increased production of affordable single-family housing starts with affordably priced lots. Those are typically going to come from grants from governmental entities or charities / nonprofits.
Methodology
This analysis was done by StorageCafe, an online platform that provides storage unit listings across the nation.
We took into consideration 108 U.S. cities with populations ranging from 90K to 8M. We ranked them by analyzing their potential with regard to starter homes, according to the following list of criteria:
Fair use and distribution
This study serves as a resource for the general public on issues of common interest and should not be regarded as investment advice. The data is true to the best of our knowledge but may change if amendments to it are made. We agree to the distribution of this content, but we do require a mention in return for attribution purposes.



Sweatshirt Storage Ideas Worth Keeping Up Your Sleeve
Sweatshirts are great until you realize how much room they take up. A few thick hoodies can fill a drawer fast, with lighter crewnecks getting squashed underneath or pushed somewhere you forget about. Good sweatshirt storage can make that pile much easier to manage without requiring a bigger closet.
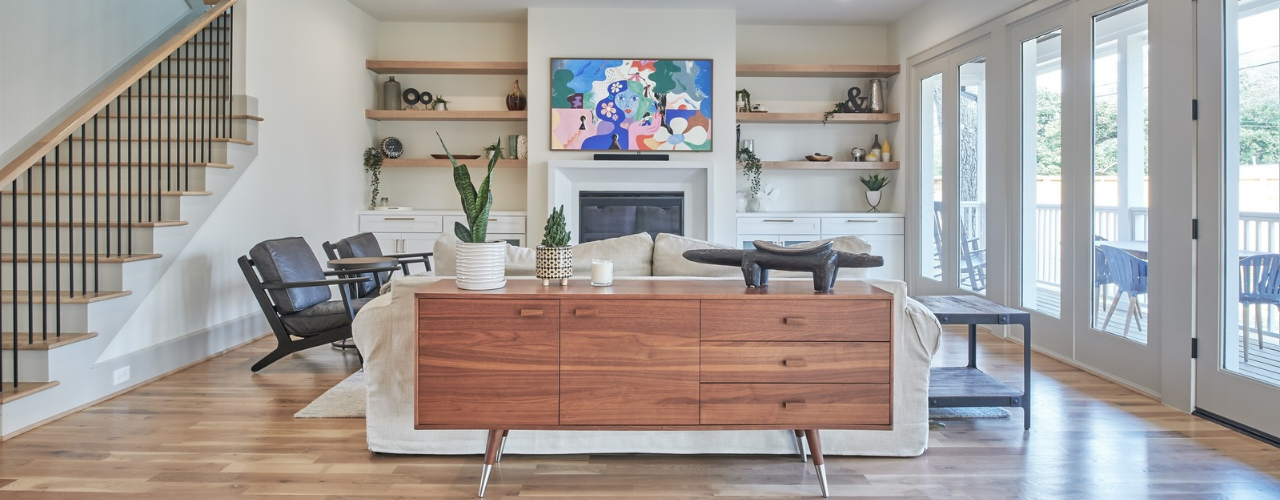
Living Room Storage Ideas: 28 Ways to Reclaim Your Hosting Space
If a living room is where most of a household’s living happens, good storage should be the top priority for setting up or revamping the place. After all, think of how easier it would be to have people over when tidying up the place is just a matter of putting things in their right place (in a time when fewer and fewer people are entertaining friends at home(opens in new tab)). The trick is making room for all those wayward clothes, blankets, chargers and other small things that end up on (or, inexplicably, in) the sofa. Here are 28 living room storage ideas to get you started and make tidying up a quick affair.
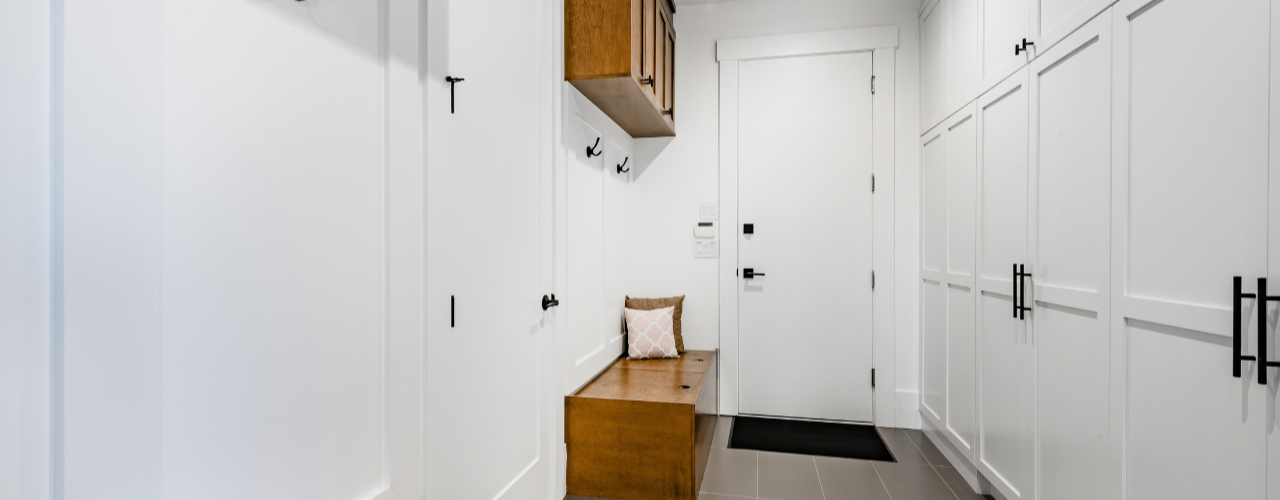
25 Mudroom Storage Ideas (And Mistakes to Avoid)
When you come home with muddy boots, an armful of bags and a coat you can’t wait to take off, it’s nice to have somewhere to put it all. With a mudroom, you can leave the outdoor mess at the door instead of carrying it through the house. Traditionally, you’d set aside a separate room, but you can just as easily use a hallway, an entryway closet, a laundry-room corner or a stretch of wall near the entrance.
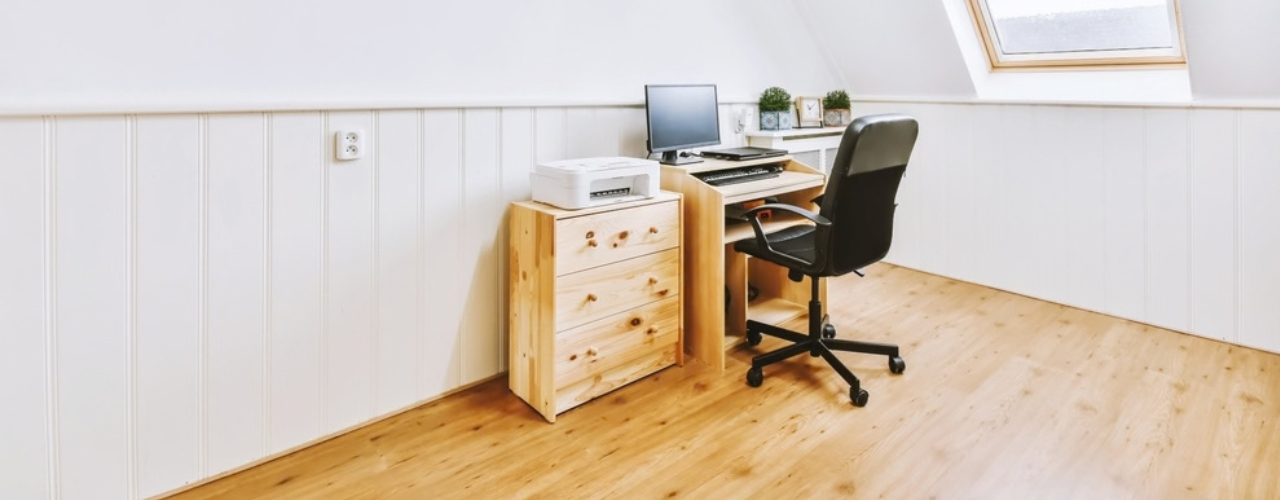
Is Your Home Office Worth the Rent? What Coworking and Self Storage Could Save You
Every square foot of your apartment comes with a price tag, and a home office claims more of them than most renters expect. It starts with a desk. Then come the second monitor, the printer, the filing cabinet and the overflow boxes. Before long, the corner you set aside for work has turned into a small room you are paying for every month.

Best U.S. Cities to Live Uncluttered: Plano, TX, Offers the Most Room to Breathe
Clutter is in our homes as much as in our heads. Both are shaped by where we live.
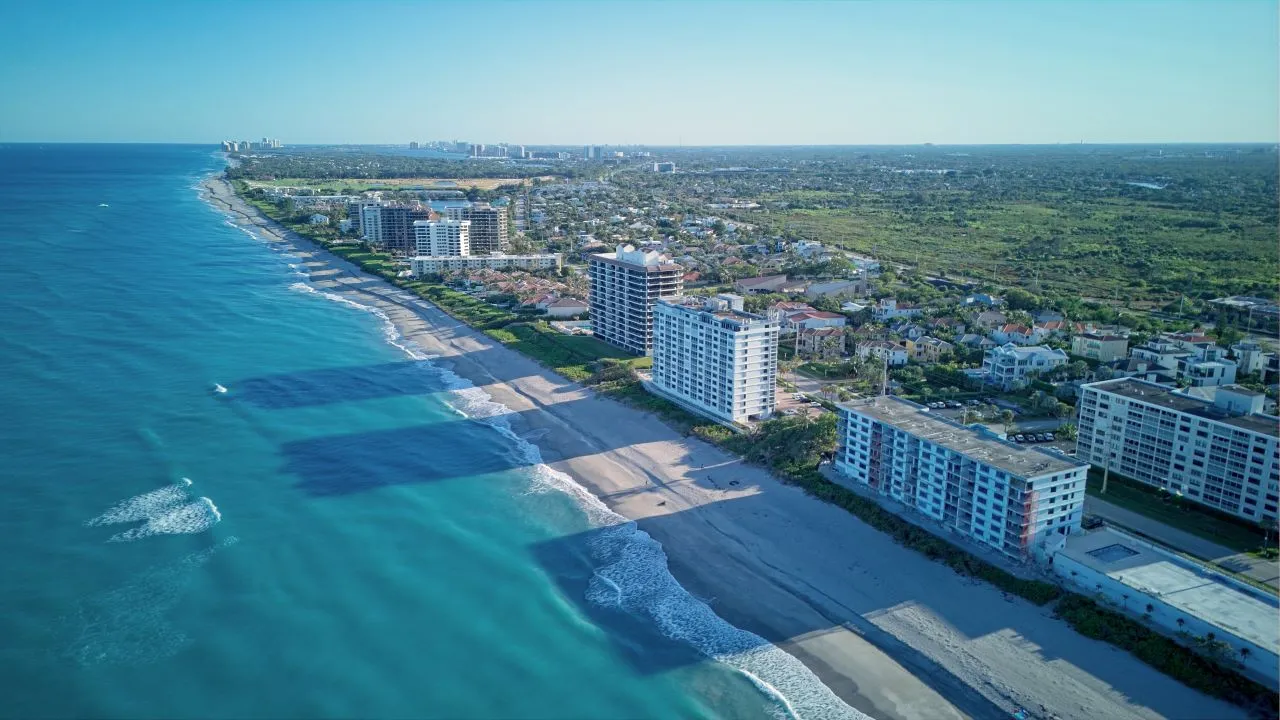
America’s Top Snowbird Destinations for 2026–2027: Florida Leads in Numbers, Texas Wins on Value
For Americans living in colder states, the approach of winter is reason enough to start looking south. Cold weather carries costs that go beyond the heating bill and shoveling snow. Seasonal affective disorder(opens in new tab) is far more prevalent in northern states, so a temporary move south isn’t simply an escape from the cold, but a chance to spend the hardest stretch of winter outdoors and in the sun.
How Much Does Halloween Really Cost in 2026? Plan Wisely to Avoid the Scare of Hidden Costs
Americans’ love for Halloween is almost frightening — this year alone, we are on our way to spending $13.5 billion, according to data from the National Retail Federation(opens in new tab). That breaks down to about $115 Halloween costs per person, a whopping 49% more than 10 years ago.

How to Store LEGOs: All the Fun, None of the Clutter
How to store LEGOs largely comes down to how your household uses them. If the bricks are part of everyday play, you need a setup that keeps them within easy reach and makes cleanup quick (for your feet’s sake, at least). Toy storage(opens in new tab) such as simple bins, playmats or containers that children can put away themselves may be enough. Larger or more serious collections usually need more organization, such as labelled drawers for loose pieces, trays for unfinished builds, shelves for completed models and separate storage for retired sets.

Cardboard Costume Guide: Tips and Ideas for a DIY Halloween
Whether for kids or adults, cardboard costume ideas often make the biggest splash once materialized, and that’s for a simple reason: doing a lot with a little is a universally impressive feat (especially in this economy). If you don’t have enough boxes you could temporarily repurpose, don’t worry! There are many places where you can find free moving boxes(opens in new tab), from stores and supermarkets to online groups and recycling drop-off spots. On the run? Try your luck at a self storage(opens in new tab) facility that sells moving supplies, often for cheap. This way, you can choose moving boxes of different shapes and sizes(opens in new tab), so you can make your costumes as complex as you want.