Best RV Destinations in the U.S. (2026): Oceanfront Drives Beat America’s Usual RV Favorites


Key Takeaways
- Coastal and beach cities lead the pack, with Gulf Coast standouts Naples, FL, Rockport, TX, and Gulf Shores, AL, scoring high across the board.
- Texas leads all states with 15 cities across all five categories, plus some of the most affordable food in the state, second only to Alabama.
- Montana’s West Yellowstone ranks among the top park gateways, with 18 campgrounds, clean air and the highest park density.
- Sun Belt winter spots — led by Zephyrhills, FL, Mission, TX, and Yuma, AZ — offer year-round infrastructure for seasonal travelers.
- Inland water destinations are the underdogs, matching top amenity scores at prices the coastal and park categories can’t touch.
- RV storage grew 9.2% nationally over the past decade as ownership rapidly expanded.
The real difference between an ordinary RV stop and a standout trip often comes down to the campground or resort you choose.
More than 8 million U.S. households already own an RV, and another 16.9 million are expected to hit the road in the next five years. With so many trips ahead — and gas prices climbing nationwide — travelers are becoming more selective, looking beyond the first available stop.
The destinations that draw people in tend to offer reasons to stay longer. Campgrounds with full hookups, solid amenities and plenty to do nearby make it easier to settle in instead of burning fuel chasing the next stop. Affordability matters, too, helping travelers extend their trips without overspending. Strong value, pet-friendly policies and thoughtful extras often define the best stays. Whether it’s a rustic campground or a full-service RV resort, these details can turn a simple overnight stop into a trip people remember long after they return home.
Which destinations are truly ready for this new RV wave?
To find out, we put 71 of America’s top RV destinations to the test – scoring each across five types every RVer has on their radar: coastal and beach escapes, desert and Sun Belt year-round bases, inland lakes, entertainment and tourism hubs and national park gateways. Every destination had to clear a minimum of 10 campsites to qualify. From there, each was scored across four areas:
- Campground quality (site count, ratings and hookup completeness)
- On-site amenities (restrooms, showers, laundry, pets, propane)
- Connectivity (Wi-Fi coverage and broadband provider count)
- Local livability (food affordability, air quality, retail density and crime rate)
The coast sets the standard, and the data makes it hard to argue otherwise. Desert and lake destinations trail it, though not without a fight — especially on amenities and affordability, where both categories give the shoreline a run for its money.
Coastal and beach destinations for RVs
Of the five categories, coastal and beach destinations post the strongest average score – the payoff of decades of seasonal tourism maturing into infrastructure RVers can count on. Beach camping has also become one of outdoor travel’s most powerful wellness draws, and the highest-rated coastal parks earned their stars on everyday service, not location alone.
Frontrunners: Naples, FL; Rockport, TX; Gulf Shores, AL; Florence, OR; Brookings, OR.
Campground quality. Rockport, TX, leads the coastal pack on sheer choice with 30 parks — the biggest campground lineup of any beach destination — all offering full electricity, water, showers, laundry and restrooms, in a town that still feels like the working Gulf Coast, not a packaged resort.
Florence, OR, posts the highest coastal rating at 4.46 stars across 17 campgrounds with full shower and restroom coverage, set in a stretch where old-growth forest and towering dunes sit side by side — one day on dune buggies, the next on quiet river trails. Close behind, Port Aransas, TX, Pensacola, FL, and Naples, FL, cluster together with similarly strong scores. On amenities, Gulf Shores, AL, is the most fully equipped stop on the coast — complete hookups plus showers, laundry and restrooms at every park — while Naples layers full power and water onto a network of pet-friendly sites.
Connectivity and livability. Naples, FL, works as well for people bringing laptops as for those just bringing beach chairs, with many parks a short drive from downtown restaurants and galleries and an easy back way into the Everglades. Pensacola, FL, adds a different twist, where the National Naval Aviation Museum and regular Blue Angels practice flights give you a built-in Plan B when the weather turns.
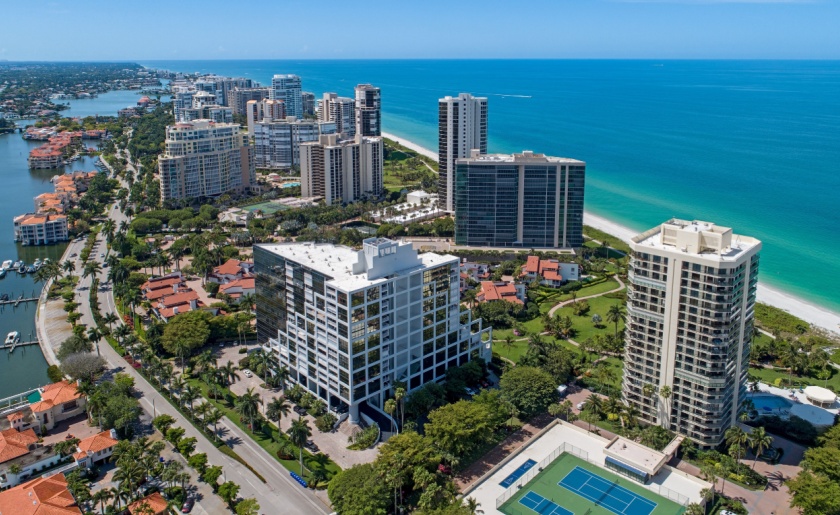
Aerial view of Park Shore in Naples, Florida
Day-to-day costs are where the Gulf even overdelivers: Gulf Shores, AL, has the lowest food costs of any coastal spot in the study, while Rockport, Port Aransas and Corpus Christi, TX, are also among the most budget-friendly beach bases. Pensacola combines low crime with convenient park access, and Naples’ strong park network supports a stay that feels comfortable and secure, so you can enjoy the scenery all the more.
Winner across the board: Naples, FL, comes out as the most balanced coastal destination, combining strong campsite supply and a 4.41-star rating with full electricity and water, some of the best retail access and 21 broadband providers. Gulf Shores, AL, follows on the strength of the coast’s most complete amenity grid and budget-friendly food costs, with Rockport, TX, close behind.
Desert and Sun Belt year-round destinations for RVs
Predictable weather removes the biggest variable in trip planning, and the destinations that lean into it run twelve months a year — which is why the Sun Belt, long the domain of snowbirds, is increasingly drawing younger, season-stretching RVers. The top performers share a thread: volume, consistency and year-round attractions built for the long, repeat stay.
Frontrunners: Zephyrhills, FL; Deming, NM; Mission, TX; Yuma, AZ; Apache Junction, AZ.
Campground quality. In the Sun Belt, RVers are spoiled for choice. Yuma, AZ, leads the desert field with 43 parks, enough to handle the winter snowbird rush without the crunch you see in other Arizona hotspots, and it backs that volume with solid electricity, water and sewer coverage.
Deming, NM, stands out on reviews, with a 4.28-star rating and full electricity, water and shower coverage. On amenities, Zephyrhills, FL, is the most fully kitted-out base in the group — 14 campgrounds with complete coverage across hookups, showers, laundry and restrooms, all pet-friendly — and Mission, TX, offers the same level of completeness across its 18 parks.
Connectivity and livability. Day-to-day comfort is where the Sun Belt really shines. Deming, NM, pairs some of the cleanest air in the group with below-average food costs, making it the kind of place where a clear night sky and an easy, affordable sit-down meal are part of the routine.
Mission, TX, leans into its spot along the Rio Grande Valley birding corridor, with winter parks that feel as much like wildlife outposts as budget-friendly bases. Zephyrhills, FL, adds its own twist with Skydive City, where parachutes speckle the sky on winter mornings and seasonal residents build their stays around the drop zones. Internet setups here are generally built to be “good enough” for extended stays rather than a marquee perk, though more park clubhouses are quietly turning into shared workspaces as laptops become as common as lawn chairs.
Winner across the board: Zephyrhills, FL, emerges as the strongest all-around Sun Belt destination, offering a fully built-out amenity grid, pet-friendly sites across the board and dependable warm weather just a short drive from Tampa, so longer stays require fewer trade-offs. Mission, TX, is the value pick, combining complete amenities with very low crime and below-average costs, while Yuma, AZ, is the go-to choice for sheer availability.
Inland water and lake destinations for RVs
The smallest destination category in the study at 10 cities, and the most underappreciated. These destinations sell themselves on water, quiet and full hookups — often at a price point the coastal and national park categories can’t touch. The top performers built the infrastructure to back that promise.
Frontrunners: Lake Havasu City, AZ; Kerrville, TX; Bullhead City, AZ; Franklin, NC; New Braunfels, TX.
Campground quality. The lake and river group stands out on infrastructure. Kerrville, TX, is one of the most thoroughly serviced stops in the mix, while Lake Havasu City, AZ, backs each of its campgrounds with full electricity and water, making it a rare place where you can launch a boat at dawn and roll straight back into lakeside hookups at night. Bullhead City, AZ, offers a similar full-service grid across its parks, with river views and easy access to Laughlin’s casinos without feeling like you’re parking in a resort lot. Franklin, NC, delivers the standout review score at 4.42 stars, and New Braunfels, TX, combines complete shower, laundry, restroom and propane coverage with unusually broad tent access.
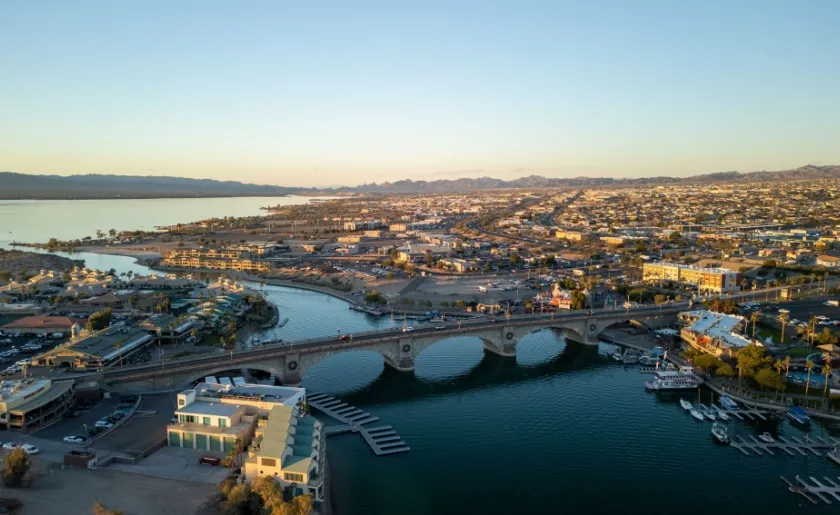
London Bridge, connecting the island of Pittsburgh Point to mainland Lake Havasu City
Connectivity and livability. Around the lakes, value for money is the underrated advantage. In Texas Hill Country, both Kerrville and New Braunfels benefit from the state’s lower food costs, with New Braunfels landing among the most budget-friendly options in the group, while Kerrville couples that with a crime rate under 1% and an easygoing arts-and-music scene where RVers walk or bike between parks, cafés and river trails along the Guadalupe.
New Braunfels layers in German heritage and “float culture,” letting you tube the Comal or Guadalupe and stroll back to your site instead of dealing with shuttles. Lake Havasu City, AZ, pairs its campground grid with some of the cleanest air readings in the group, and Franklin, NC, adds crisp Appalachian air, fully pet-friendly parks and a quirky draw as the “Gem Capital of the World,” where nearby mines turn a rainy day into a treasure hunt. Internet and bandwidth tend to be adequate rather than a headliner, part of the tradeoff for quieter, more low-key settings.
Winner across the board: Lake Havasu City, AZ, edges out a tight field by combining one of the largest campground counts with full electricity and water, universal showers and restrooms, clean air and strong retail access. With hundreds of miles of Colorado River shoreline and sun-splashed weather most of the year, it’s one of the few lake bases where the infrastructure feels built for extended, full-hookup stays instead of just weekend crowds. Franklin, NC, follows as the runner-up on the strength of its campground count and top-tier rating, with Kerrville, TX, as the value pick for its complete amenity setup and Hill Country prices.
Entertainment and tourism hubs for RVs
From the Ozark hills to the neon, these destinations treat campground infrastructure as seriously as the attractions themselves — trading the ocean view for theme parks, live music and festivals, which for a growing share of RVers is the whole appeal. Two of the category’s standouts are mountain towns at heart, pairing built-up itineraries with Ozark and Smoky Mountain settings, and supply here tracks repeat visitors rather than scarcity.
Frontrunners: Branson, MO; Pigeon Forge, TN; Tyler, TX; Houston, TX; Wisconsin Dells, WI (with Sevierville, TN, as a runner-up).
Campground quality. Branson, MO, is the anchor: 25 RV parks in a town of about 13,000, tucked into the Ozark hills around Table Rock Lake, with full electricity and water, universal showers and broad laundry coverage. It also backs a dense lineup of live shows in peak season, so a stay feels almost like a land-based cruise — different headliners at night, then tree-lined sites to retreat to, with Silver Dollar City even running its own shuttle-served campground so you can do a full theme-park day without unhooking.
Pigeon Forge, TN, posts a 4.39-star rating — matched by runner-up Sevierville, TN, which adds 100% pet-friendly sites — and has become one of the easiest RV bases for accessing the country’s most-visited national park, with parks that run like resorts (pools, lazy rivers, on-site trolley stops) and flat valley roads that spare big rigs the steeper grades common in the Smokies. Houston, TX, covers its metro with 14 campgrounds at full electricity, water and sewer; Wisconsin Dells, WI, adds universal tent access and the highest dump-station coverage in the group; and Tyler, TX, rounds things out with complete hookups across its sites.
Connectivity and livability. In these entertainment hubs, bandwidth matters as much as the marquee attractions. Houston, TX, tops the group for connectivity with dozens of broadband providers and widespread Wi‑Fi — business-class connections in a relatively affordable metro, so remote workers can settle in for a month and still slip out to Space Center Houston or city museums after hours. Tyler, TX, offers Wi‑Fi coverage across the board and really shines during azalea and rose seasons, when blooms stretch “peak season” across weeks instead of a single weekend.
Pigeon Forge ranks among the best-connected hubs and pairs that with the highest retail density in the study, while Wisconsin Dells leans into its “Waterpark Capital” identity, keeping parks busy beyond summer with heated indoor waterparks that turn shoulder seasons into family-trip territory. Sevierville, TN, works as the corridor’s practical stop — outlets, big-box stores and RV service centers before you disappear into the mountains — and the Texas hubs benefit from the state’s relatively low food costs across the board.
Winner across the board: Branson, MO, stands out as the only hub that scores high on all fronts at once — campground volume, amenity completeness, solid connectivity and approachable costs — without forcing the usual trade-offs between price, quality or availability. The Ozarks deliver the scenery; the town delivers the shows, services and infrastructure that keep RV stays running smoothly.
National park gateway destinations for RVs
Gateways draw the most iconic demand and face the tightest supply — environmental limits cap new campground development near protected land, and short seasons concentrate a year’s demand into narrow windows. The winners are the mountain towns that did the hard infrastructure work anyway.
Frontrunners: Custer, SD; Hot Springs, AR; South Fork, CO; West Yellowstone, MT; Rapid City, SD.
Campground quality. This gateway group is where campground standards peak. Custer, SD, sets the bar with a 4.55-star rating — the highest in the category — across 22 campgrounds, all with showers and restrooms and policies that welcome both pets and tents, in a Black Hills setting where granite spires and bison herds are a short drive from camp and scenic loops replace interstate miles. South Fork, CO, follows with a 4.40-star score, and Rapid City, SD, at 4.33, layers that quality onto full shower, laundry and restroom coverage plus the strongest dump-station access in the group. Hot Springs, AR, delivers full electricity, water, sewer, shower and restroom coverage across all 12 of its campgrounds, while West Yellowstone, MT, scales 18 parks to handle peak summer demand, using its flat, gridded layout to make big-rig parking and walking to the park gate unusually straightforward.
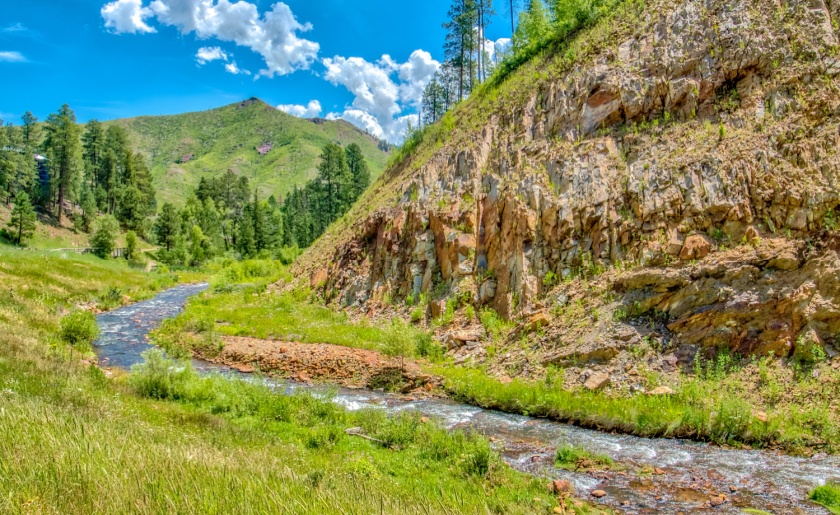
Custer State Park in South Dakota
Connectivity and livability. Because these towns sit next to protected land, bandwidth is the pinch point, which makes the standouts easy to spot. Hot Springs, AR, is the best-connected of the group with the deepest roster of broadband providers, and South Fork, CO, punches far above its size with the strongest Wi‑Fi coverage in the category despite being a town of fewer than 700 people and a junction of three scenic byways.
On livability, West Yellowstone, MT, offers near-pristine air quality and the highest park density of any gateway, so in shoulder season you can let the clouds choose between trails, geyser loops or a café day. Hot Springs keeps food costs well below what you see in many mountain and coastal gateways, and Rapid City, SD, pairs clean air with affordable groceries and services, functioning as the practical reset point where RVers handle maintenance and big stock-ups before disappearing back into park country.
Winner across the board. Custer, SD, takes the top spot on the metric that matters most to gateway travelers: campsite quality, with its 4.55-star rating leading all national park destinations, backed by 22 campgrounds, universal showers and restrooms, and pet- and tent-friendly policies throughout. Nestled in the Black Hills near signature drives and wildlife loops, it’s a rare gateway where you can leave the rig in camp and still spend the day chasing scenery without touching the interstate. As a runner-up, Hot Springs, AR, stands out as the value choice — the most affordable and most logistically complete of the group, and the only one where the national park sits inside the city itself.
RV storage: what it costs and where supply is growing
Owning an RV and having somewhere to keep it are two different problems. For the 8 million-plus households that own one today, storage is rarely optional — HOA rules, undersized driveways and garages built for sedans make dedicated RV storage a practical necessity for most owners, and the difference between a rig that’s road-ready year-round and one that spends half its life in logistical limbo.
The market has responded. Nationally, the number of facilities offering RV storage has grown significantly over the past decade, with some markets doubling their supply. Myrtle Beach, SC, leads that expansion with 125% growth in facilities, followed by Surprise, AZ, at 100% and Cape Coral, FL, and San Luis Obispo, CA, each at 50%. The Sun Belt and Southeast are clearly where the buildout is happening fastest — which tracks with where the rigs are.
Not every high-demand market has caught up, though — and the gap shows up in pricing. Katy, TX, combines the highest search intensity in our sample with only moderate per‑capita RV storage space (7.5 sq. ft), a configuration that helps keep rates elevated at around $240 per month. Apache Junction, AZ, and Fort Myers, FL, follow in search interest. Fort Myers is the exception: at 14.1 square feet per capita and rates that reflect a more balanced market, it’s one of the few high-demand cities where availability has kept pace with demand.
On cost, the spread is wide and largely coastal. California dominates the expensive end: Hayward, San Francisco and Los Angeles sit above $490 per month, while Huntington Beach, San Clemente and Anaheim all clear $440. At the other end, Lubbock, TX, and Kansas City, KS, offer some of the most affordable options in the dataset at $107 and $94 respectively — another quiet advantage for the Texas and Midwest markets that already score well on RV livability. Shopping the storage market before you buy the rig is as smart as scouting the campground.
U.S. Cities Where RV Storage Keeps Up With Demand (And Where It Lags)
| City | State | Monthly Search Volume per 1000 Residents | SS Per capita | Avg. RV Storage Rent ($) | Number of Facilities with RV Storage | 10-Year Change in RV Storage Facilities (%) |
|---|---|---|---|---|---|---|
| Kansas City, KS | KS | 0.32 | 2.9 | 94 | 8 | 14% |
| Lubbock, TX | TX | 0.98 | 17.6 | 107 | 26 | 13% |
| Springfield, MO | MO | 0.82 | 12.9 | 124 | 12 | 20% |
| Oklahoma City, OK | OK | 0.30 | 9.2 | 131 | 56 | 8% |
| Idaho Falls, ID | ID | 2.51 | 15.5 | 135 | 8 | 33% |
| Bakersfield, CA | CA | 0.51 | 10.0 | 138 | 34 | 10% |
| Menifee, CA | CA | 0.18 | 3.8 | 138 | 2 | 0% |
| Apache Junction, AZ | AZ | 5.11 | 4.2 | 145 | 9 | 13% |
| Tucson, AZ | AZ | 2.38 | 9.1 | 147 | 62 | 17% |
| Acworth, GA | GA | 0.89 | 4.4 | 150 | 8 | 14% |
| Cincinnati, OH | OH | 0.45 | 4.3 | 151 | 25 | 14% |
| San Antonio, TX | TX | 0.40 | 9.6 | 155 | 105 | 11% |
| Boise, ID | ID | 1.10 | 12.3 | 160 | 19 | 19% |
| Houston, TX | TX | 0.38 | 7.0 | 160 | 168 | 8% |
| Omaha, NE | NE | 0.35 | 7.5 | 160 | 25 | 32% |
| Baton Rouge, LA | LA | 0.49 | 11.3 | 164 | 17 | 13% |
| Kansas City, MO | MO | 0.22 | 3.8 | 167 | 16 | 23% |
| Arvada, CO | CO | 0.90 | 3.6 | 170 | 10 | 67% |
| Indianapolis, IN | IN | 0.16 | 7.1 | 171 | 50 | 16% |
| Albuquerque, NM | NM | 0.69 | 7.6 | 172 | 36 | 13% |
| Round Rock, TX | TX | 0.55 | 6.6 | 175 | 14 | 0% |
| San Luis Obispo, CA | CA | 1.44 | 15.2 | 179 | 6 | 50% |
| Arlington, TX | TX | 0.23 | 6.2 | 184 | 24 | 14% |
| Henderson, NV | NV | 0.63 | 6.6 | 186 | 22 | 10% |
| Rancho Cucamonga, CA | CA | 0.97 | 4.6 | 191 | 7 | 17% |
| Colorado Springs, CO | CO | 1.48 | 11.6 | 193 | 44 | 26% |
| Mesa, AZ | AZ | 0.94 | 6.1 | 195 | 46 | 24% |
| Phoenix, AZ | AZ | 0.29 | 5.6 | 201 | 71 | 15% |
| Modesto, CA | CA | 1.78 | 6.8 | 202 | 12 | 20% |
| Hemet, CA | CA | 0.99 | 5.2 | 208 | 6 | 0% |
| Las Vegas, NV | NV | 1.33 | 8.2 | 211 | 104 | 7% |
| Boston, MA | MA | 0.03 | 0.7 | 220 | 2 | 0% |
| Indio, CA | CA | 1.85 | 7.3 | 221 | 8 | 33% |
| Myrtle Beach, SC | SC | 4.43 | 12.6 | 223 | 9 | 125% |
| Vancouver, WA | WA | 0.56 | 8.5 | 224 | 32 | 33% |
| Carrollton, TX | TX | 0.15 | 5.2 | 224 | 11 | 0% |
| New Orleans, LA | LA | 0.24 | 4.6 | 226 | 13 | 18% |
| Chino, CA | CA | 1.19 | 2.8 | 227 | 2 | 0% |
| Chicago, IL | IL | 0.04 | 3.5 | 227 | 46 | 5% |
| Austin, TX | TX | 0.33 | 7.9 | 229 | 53 | 8% |
| Tampa, FL | FL | 0.42 | 7.3 | 233 | 44 | 2% |
| Reno, NV | NV | 0.95 | 14.6 | 235 | 17 | 31% |
| Sacramento, CA | CA | 0.74 | 5.1 | 235 | 49 | 14% |
| Surprise, AZ | AZ | 2.07 | 7.9 | 238 | 10 | 100% |
| Katy, TX | TX | 12.71 | 7.5 | 240 | 24 | 26% |
| Lake Elsinore, CA | CA | 1.52 | 7.0 | 242 | 6 | 20% |
| Orlando, FL | FL | 0.81 | 7.1 | 249 | 59 | 11% |
| Denver, CO | CO | 0.54 | 3.5 | 257 | 22 | 0% |
| Richmond, VA | VA | 0.48 | 6.0 | 262 | 21 | 0% |
| Temecula, CA | CA | 1.26 | 7.2 | 264 | 7 | 0% |
| Oceanside, CA | CA | 0.64 | 3.1 | 268 | 8 | 0% |
| Virginia Beach, VA | VA | 0.46 | 11.2 | 275 | 25 | 4% |
| Nashville, TN | TN | 0.30 | 7.1 | 279 | 21 | 24% |
| Cape Coral, FL | FL | 0.79 | 8.7 | 281 | 6 | 50% |
| Dallas, TX | TX | 0.16 | 5.2 | 282 | 49 | 2% |
| Salt Lake City, UT | UT | 1.25 | 3.8 | 283 | 21 | 5% |
| Chula Vista, CA | CA | 0.40 | 3.8 | 291 | 13 | 18% |
| Fort Myers, FL | FL | 5.05 | 14.1 | 312 | 27 | 35% |
| Palm Springs, CA | CA | 2.44 | 9.3 | 324 | 6 | 20% |
| Riverside, CA | CA | 0.81 | 5.7 | 330 | 25 | 0% |
| Murrieta, CA | CA | 1.87 | 5.3 | 336 | 11 | 22% |
| Santa Clarita, CA | CA | 1.13 | 4.4 | 343 | 4 | 0% |
| Miami, FL | FL | 0.30 | 4.0 | 368 | 43 | 10% |
| Long Beach, CA | CA | 0.37 | 2.0 | 371 | 13 | 0% |
| Bellevue, WA | WA | 0.13 | 5.1 | 372 | 8 | 0% |
| Simi Valley, CA | CA | 1.35 | 6.1 | 388 | 2 | 0% |
| San Jose, CA | CA | 0.21 | 3.9 | 400 | 13 | 0% |
| Scottsdale, AZ | AZ | 0.37 | 9.2 | 425 | 16 | 7% |
| San Diego, CA | CA | 0.35 | 4.2 | 428 | 31 | 3% |
| San Clemente, CA | CA | 0.47 | 4.2 | 447 | 2 | 0% |
| Anaheim, CA | CA | 0.20 | 1.5 | 449 | 11 | 0% |
| Huntington Beach, CA | CA | 0.87 | 2.4 | 451 | 5 | 0% |
| Richmond, CA | CA | 0.17 | 4.1 | 494 | 8 | 0% |
| San Francisco, CA | CA | 0.11 | 2.0 | 496 | 7 | 0% |
| Seattle, WA | WA | 0.19 | 4.3 | 503 | 16 | 14% |
| Hayward, CA | CA | 0.13 | 2.6 | 510 | 5 | 0% |
| Los Angeles, CA | CA | 0.07 | 2.1 | 588 | 17 | 0% |
| Fort Lauderdale, FL | FL | 0.59 | 3.8 | 596 | 6 | 0% |
The road is ready. The question is where you point it.
The U.S. is full of natural beauty and local fun. But only some of it is equipped to help RVers make the most of that. From Gulf Coast beach towns to Black Hills gateways and neon-lit Ozark corridors, the winners are the destinations that do the unglamorous work: building enough campgrounds, wiring in full hookups and Wi-Fi, and running RV parks well enough that travelers say so in the reviews.
It’s how Naples leads the coast on resort-grade hookups, deep connectivity and low crime; how Zephyrhills tops the Sun Belt with a full-coverage amenity grid 30 miles from Tampa; and how Lake Havasu City wins the lakes by pairing full-hookup sites with some of the cleanest air anywhere. It’s how Branson packs 25 parks into a town of 13,000 to take the entertainment hubs, and how Custer crowns the gateways with the highest-rated campsites in its category.
Plenty of iconic spots are still worth visiting, but thin campsite supply and spotty amenities can turn a dream stop into a scramble. As RV ownership climbs toward 25 million households, the gap between well-prepared and under-equipped destinations will only widen. Choosing destinations that have already invested in this backbone is the simplest way to turn a one-night stop into the kind of stay you talk about all year.
Methodology
This analysis was conducted by StorageCafe, an online platform offering nationwide listings for storage units. To identify the best RV destinations in the U.S. for 2026, we built a weighted index across 71 destinations, retaining only those with a minimum of 10 RV campsites. Cities were scored across four broad areas: campground quality, on-site amenities, connectivity and local livability.
Campsite data — including site count, ratings, hookup availability and on-site amenities — was sourced from FindRVParks. Internet provider availability came from BroadbandNow. Food affordability is based on the Cost of Living Index via RentCafe, measured at the state level. Air quality data was obtained from the U.S. Environmental Protection Agency at the county level, using the median Air Quality Index score. Retail outlet density is expressed as outlets per 1,000 residents using County Business Patterns data. Crime rate is sourced from the FBI. Park access — defined as free public parks per 1,000 residents — comes from the Trust for Public Land. Self storage data, including facility counts, rent and ten-year supply growth, is sourced from Yardi Matrix, StorageCafe’s sister division and a business development and asset management tool for brokers, sponsors, banks and equity sources underwriting investments in the multifamily, office, industrial and self storage sectors.
Metric weights are as follows: number of campsites (30%), campsite rating (5%), electricity hookup availability (5%), water hookup availability (5%), sewer hookup availability (5%), dump station availability (2.5%), pet-friendly policies (2.5%), Wi-Fi coverage (2.5%), cable coverage (2.5%), restroom availability (2.5%), shower availability (2.5%), laundry availability (2.5%), propane availability (2.5%), tent access (2.5%), internet provider count (2.5%), food affordability index (5%), median AQI (5%), retail outlets per 1,000 residents (5%), crime rate (5%) and parks per 1,000 residents (5%).
Fair Use and Distribution: This study may be freely reprinted and shared for editorial, news and informational purposes with attribution to StorageCafe (storagecafe.com). A link back to the original page is required when citing or referencing the research. For commercial licensing inquiries, please contact StorageCafe directly.


Best RV Destinations in the U.S. (2026): Oceanfront Drives Beat America’s Usual RV Favorites
The real difference between an ordinary RV stop and a standout trip often comes down to the campground or resort you choose.

Where to Donate Furniture in NYC (With Free Pick-Up Options)
Finding somewhere to donate furniture in NYC is more complicated than it should be. Not every organization accepts large items, pick-up availability is inconsistent, and the options that do exist aren’t always easy to find in one place. If you’re specifically hoping to donate furniture with free pick-up, the list of options gets even shorter.

Clean Out, Give Back: Where to Donate Clothes in Los Angeles
Few cities reinvent themselves like Los Angeles, and wardrobes tend to follow suit. Between changing seasons, evolving trends and an endless calendar of occasions worth dressing for, closets fill up fast, making the question of where to donate clothes in Los Angeles one that most Angelenos eventually find themselves asking.

How to Store Shoes Based on Your Personality
Your shoe closet is lying — not about how many pairs you own (that number is likely higher than you’d admit), but about who you are. The way you approach shoe storage, or avoid it, is one of the more honest reflections of your personality that exists in a home.

Tiny Home Storage Ideas for Every Nook and Cranny
Tiny home storage is one of those challenges that sounds straightforward until you’re standing in 200 square feet wondering where the winter coats are supposed to go. You didn’t downsize for the storage anxiety — you did it for the coziest place you’ve ever called home, a wallet that finally feels lighter, and a minimalist lifestyle that suits you just fine.

Best States for Electric Vehicles (2026): The West Leads EV Adoption, Oklahoma Speeds Up
Last updated: June 22, 2026.
")
Self Storage Discounts: Types, Tips and How to Get the Best Deals for Your Needs
When you start looking for a self storage unit to rent, one thing becomes clear very quickly: self storage discounts are a standard part of the industry. From introductory specials to military savings and online-only rates, operators frequently offer promotions designed to make renting a unit more affordable and flexible.

How Self Storage Can Help Event Planners
When you attend a great event, you rarely think about the choreography happening behind the curtain or after the last guest leaves. Unless, of course, you’re an event planner — an industry that has grown 8.6% per year on average over the five years between 2020 and 2025. It shows no signs of slowing down either, as small businesses and event planners continue to carve out their place across America.

Most Fun Cities In The U.S.: Miami & Orlando Rule The Fun Access Map, While Phoenix Reveals A Growing Leisure Divide
Are Americans going out less, or just living in places that make going out harder?