
North Carolina Migration Map: Which Counties Attract Gen Z Renters, Which Draw Boomer Buyers?


Key Takeaways
- North Carolina welcomed 696,160 new residents in 2023, while around 608,590 people moved out to other states. This resulted in a net gain of 87,570 residents for the year — that’s roughly 240 people per day added to the state’s population.
- Pitt County, anchored by Greenville, led in net migration with 9,220 new residents, followed by Wake County (Raleigh), with 7,220.
- Pitt County also leads in Gen Z migration (59% of the county’s influx) but it also has the lowest homeownership rate (20%).
- The Charlotte area (Mecklenburg County) had the highest overall mobility with 75,140 move-ins and 72,240 move-outs, for a net gain of 2,900.
- Cumberland, whose county seat is the military city Fayetteville, experienced the largest outflow, losing 4,950 residents despite a high share (54%) of Gen Z in new arrivals.
- Wake County had the highest share of remote workers among new arrivals (27%) and the second highest share of college-educated migrants (42%).
- Among the major hotspots, the biggest shares of homeowners among migrants were in Rockingham and Stokes (74%), as well as Brunswick (67%).
- Mecklenburg County, anchored by Charlotte, had the highest share of renters (67%), followed by Wake County, represented by Raleigh (60%).
North Carolina continues to shine as one of the top destinations for people relocating across the U.S. In 2023 alone, the state welcomed about 900 new residents every day, while 660 moved away — leaving a net gain of roughly 240 people daily, or over 87,000 new residents throughout the year, according to our latest migration study based on U.S. Census data.
Zooming in, a few standout counties are driving that growth. Take Pitt County, for example — it combines affordable housing and a small-town feel with access to larger job markets. It’s also the top draw for Gen Z movers, who make up the largest share of newcomers there.
In fact, Gen Z leads the pack in 7 of the top 10 fastest-growing counties. Most of these young newcomers are renting.
On the flip side, Brunswick County (Wilmington) is one of the few places attracting a good number of Baby Boomers, and 67% of new arrivals there are homeowners.
Homeownership is especially strong in places like Rockingham and Stokes Counties, where around 74% of newcomers bought a home within their first year — a rate similar to Davidson and Brunswick Counties, both at 67%. But it’s a different story along the coast: in Pitt County, just 20% of newcomers became homeowners, the lowest share among top counties — meaning most are choosing to rent for now.
When it comes to out-of-state migration, Lenoir, Onslow, and Jones Counties top the list. About 70% of people moving in came from outside North Carolina, unlike most other top counties where newcomers tend to relocate from elsewhere within the state. Mecklenburg County (Charlotte) also stands out, with 63% of new residents coming from beyond state lines – a sign of its strong pull as a major metro hub.
Best moving destinations in North Carolina: Gen Z leads growth in 7 of the top 10 net migration counties
Migration in North Carolina last year flowed strongest into counties outside the biggest cities, led by places like Pitt, Wake, and Orange. Young Gen Z renters seeking affordable, active lifestyles, millennials putting down roots, and coastal baby boomers all played a role in shaping different local markets.
Here’s a full breakdown of net migration across North Carolina counties, along with supporting data that illustrates the underlying trends:
Below, you’ll find the top 10 counties posting the strongest net migration gains in North Carolina.
1. Pitt County, NC
Net move-ins: 9,220
From NC: 68%
Biggest demographic: Gen Z
Homeowner/renter ratio among move-ins: 20% / 54%
Pitt County, home to thriving Greenville, takes the lead in net migration, and that isn’t even its only highlight. Crowned both as NC’s best college town and the nation’s trendiest city among Gen-Zers, Greenville is still pulling in a new crowd. The truth is, many twenty-somethings want what it offers: low living costs, walkability, and opportunities to build a social life while laying down roots or starting a family.
Plus, a median home price still under $200,000 makes a hopeful context for the new residents, given that they claim the lowest median income among NC’s major migration magnets: $28,130 (below the national average, but above the average national income for Gen Zers).
Most of those newcomers don’t come from far away. Georgia tops the list, with a fascinating influx: 51% remote-workers, an average age of 18, and an 88% rentership rate. This data likely mixes digital nomads and young people attending East Carolina University.
A second wave comes from older households in Florida and New Jersey, most of whom are still renting. What unites them is the same pull: lower cost of living and an economic engine that’s still accelerating.
2. Wake County, NC
Net move-ins: 7,220
From NC: 44%
Biggest demographic: Gen Z
Homeowner/renter ratio among move-ins: 30% / 60%
73,800 move-ins — the biggest influx, save for Mecklenburg County (Charlotte). Take away the 66,600 residents moving out, and you get NC’s second biggest migrant magnet, with a net gain of over 7,200 residents.
With Raleigh emerging as the best performing economy in the nation, Wake has experienced one of the state’s biggest population booms from 2018 to 2023 — 10%. This is even as median home prices hover around $420,000. Wake also has the largest share of remote workers among new migrants — further proof of Raleigh’s booming tech scene. Here, suburban sprawl continues, as downtown’s price tags keep some at a distance.

Neighborhood in Raleigh, North Carolina
Migration numbers confirm it: over half of Wake’s influx is from outside of North Carolina — the only county in the top 10 that can claim this feat. About 4,670 new residents came from New York and 3,670 from Florida, many in their early thirties, most not yet ready to buy. Thousands of newcomers also came from Virginia, California and Georgia.
3. Wilson, Greene & Johnston Counties, NC
Net move-ins: 6,840
From NC: 71%
Biggest demographic: Millennial
Homeowner/renter ratio among move-ins: 46% / 42%
Johnston County has stood out for its raw speed of growth for many years now. People keep moving here, driven largely by affordable homes and the county’s increasing three interstate roads that all lead straight into Raleigh. And with the southern loop of NC 540 soon to be completed, Johnston is set to grow further and further.
The county’s millennial-heavy migration pattern shows a larger share of buyers than renters among newcomers, a rarity in this list. New York remains the top origin for out-of-state movers, though work-from-home rates there are low.
4. Pender & New Hanover Counties, NC
Net move-ins: 6,760
From NC: 52%
Biggest demographic: Gen Z
Homeowner/renter ratio among move-ins: 39% / 47%
As Wilmington keeps booming, population growth is becoming a topic of debate in both Pender and New Hanover. Young Americans are flocking to these counties to put down roots in the suburbs while enjoying a coastal climate with all the four seasons.
Arrivals come from every direction, as the county stands out for its high share of newcomers from outside NC: young renters from New York and Virginia, slightly older transplants from Florida and Pennsylvania who are more likely to buy.
5. Orange County, NC
Net move-ins: 5,790
From NC: 60%
Biggest demographic: Gen Z
Homeowner/renter ratio among move-ins: 30% / 44%
When it comes to migration, Orange County’s high standard of living is enough to make up for its housing costs — which are steeper than other peer counties in NC. Hillsborough keeps drawing residents who value history as much as modern amenities, and the migration data shows most arrivals still rent first.
When it comes to out-of-state migrants, many come from Florida, often working remotely and still choosing to rent rather than buy. Other origin states, with half of Florida’s output, include Virginia, Texas and Pennsylvania.
6. Forsyth County, NC
Net move-ins: 4,970
From NC: 50%
Biggest demographic: Gen Z
Homeowner/renter ratio among move-ins: 39% / 45%
Forsyth County, anchored by Winston-Salem, is attracting a steady influx of younger residents drawn to its affordable housing and artsy energy. Median home prices under $230,000 and rents barely topping $1,000 keep Forsyth’s cost of living in reach, even as bigger Sun Belt cities price out would-be buyers.

Downtown Winston-Salem, North Carolina
What’s more, half of Forsyth’s influx is from out of state — many of the new faces come from Florida, Virginia, and Georgia, often older than the local Gen Z surge and more likely to own if they’re from Florida. Virginia arrivals are younger and mostly renters, while Georgia’s newcomers split almost evenly between renting and buying.
7. Boone High Country, NC
Net move-ins: 4,870
From NC: 70%
Biggest demographic: Gen Z
Homeowner/renter ratio among move-ins: 26% / 33%
Up in the Appalachian Mountains, Boone High Country brings together Ashe, Avery, Mitchell, Yancey and Watauga Counties. All these counties have the kind of natural beauty and recreational opportunities that make it irresistible to many young professionals. Add in the presence of Appalachian State University, and you’ve got a bevy of new residents coming into Boone, which has admittedly strained its housing supply.
Among out-of-state newcomers, Floridians dominate once again — older on average and overwhelmingly homeowners. Aside from Florida, South Carolina is the second largest origin state. In fact, 70% of newcomers are from other counties in North Carolina.
8. Guilford County, NC
Net move-ins: 4,850
From NC: 59%
Biggest demographic: Gen Z
Homeowner/renter ratio among move-ins: 23% / 49%
With a diverse economy in and around the college town of Greensboro, Guilford keeps collecting new residents, but it’s the rental market that feels it first. Median home prices hover under $235,000, still reasonable by national standards, yet ownership among newcomers remains low. Local leaders talk openly of economic reinvention, even considering pledging over $75 million to a mystery company.
Out-of-state migration data shows Virginia, Florida, and New York leading the charge. Many are in their twenties and thirties, most of whom are still renting, and work-from-home rates stay low compared to coastal counties. The appeal appears rooted in price and location.
9. Davie, Yadkin & Iredell Counties, NC
Net move-ins: 4,750
From NC: 59%
Biggest demographic: Millennial
Homeowner/renter ratio among move-ins: 52% / 43%
Here, the new arrivals look different: slightly older, more likely to buy than rent. The region’s economy ranks among the best in North Carolina, yet it’s the suburban, almost rural feel — and lower cost of living — that wins over millennials ready to leave dense cities behind.
Over half of newcomers are homeowners, one of the highest shares overall. And many new residents come from New York, older than the average among newcomers, with high rates of remote work. Yet three out of four rent, which perhaps points to a cautious step before buying in a still-evolving housing market.
10. Brunswick County, NC
Net move-ins: 4,730
From NC: 54%
Biggest demographic: Baby Boomer
Homeowner/renter ratio among move-ins: 67% / 29%
Life on the coast often attracts baby boomers who seek to make the most of their golden years. And Brunswick knows how to bank on its coastal location, emerging as NC’s only major migration hotspot with a large majority of baby boomers among its new migrants. Plus, nearly seven in ten newcomers choose to buy homes. What’s more, Brunswick also leads major migration hotspots in earnings, with a median income of $57,600.

Holden Beach in Brunswick County, North Carolina
The largest group of newcomers arrived from New Jersey, which sent 734 migrants with a whopping homeownership rate of 85% and an average age of 56. Other major origin counties are South Carolina, Maryland and New York.
North Carolina’s exodus: Counties with the biggest resident losses
While many North Carolina counties continue to draw in new residents, some places are seeing movement in the opposite direction. Fayetteville, Asheville, and Winston-Salem all posted significant net migration losses in 2023, signaling local economic pressures and shifting resident priorities.
Fayetteville, NC: balancing military mobility with economic hurdles
Fayetteville recorded the largest outflow in the state, with an estimated 4,950 residents moving away. The city’s close ties to Fort Liberty (formerly Fort Bragg) — one of the largest military installations in the U.S. — mean that frequent relocation among service members and their families plays a major role in resident turnover.
But military churn isn’t the only factor. Fayetteville’s 4.7% unemployment rate, one of the highest among major NC metros, may be making it harder to retain long-term residents. Despite that, the city still draws a young population, with Gen Z accounting for 54% of new arrivals. The average age of newcomers is just 27, suggesting that affordability and entry-level opportunities still resonate with younger movers.
Asheville, NC: losing residents amid economic strain
In Asheville, rising costs and limited economic opportunity are contributing to a net loss of 2,240 residents. The city’s 4.5% unemployment rate mirrors Fayetteville’s, and while it retains appeal for Millennials and lifestyle-driven movers, that hasn’t been enough to offset the outbound trend. Long known for its arts scene and proximity to the Blue Ridge Mountains, Asheville’s high cost of living may be pushing some residents to seek more affordable alternatives elsewhere in the state.
Winston-Salem, NC: flat growth drives outflow
Winston-Salem rounds out the list with a net loss of around 2,040 residents in 2023. Unlike the more cyclical challenges of Fayetteville or the cost pressures of Asheville, Winston-Salem has faced years of modest or flat population growth. Without significant new job creation or large-scale investment, the city appears to be gradually losing ground to faster-growing metros in the Triangle and Charlotte regions.
Self storage meets the moment in North Carolina’s high-migration cities
As North Carolina cements its place among the top states for population growth, a less visible — but increasingly vital — resource is quietly supporting that surge: self storage. With more people on the move, driven by economic opportunity, lifestyle shifts, and remote work flexibility, demand for temporary and long-term space solutions is growing steadily. Across the state’s urban hubs and regional magnets, storage developers are keeping pace.
Charlotte, North Carolina’s economic powerhouse, also ranks first in total self storage inventory, with nearly 8 million square feet available citywide. That works out to 7.4 square feet per capita, a solid benchmark for a large metro — and a necessary one, given the city’s high inbound migration. The average unit rents for $121/month, offering flexibility to renters and homeowners alike in a fast-paced housing market.
North Carolina’s capital, Raleigh, mirrors its migration magnet status with 4.9 million square feet of inventory and 7.6 square feet per capita — just enough to keep pace with its fast-growing population. Storage rents hover at $116/month, aligning closely with its housing trends and the rising demand from remote workers, transplants, and expanding families.
Meanwhile, in the heart of the Piedmont Triad, Greensboro combines affordability with capacity. With 11.2 square feet per capita, the city sits near the top in terms of storage availability, while charging just $95/month — the lowest rate among North Carolina’s major metros. This affordability mirrors local housing trends, where rents and home prices remain accessible compared to Raleigh or Charlotte.
Durham, anchored by its booming tech and university ecosystem, maintains a healthy 9.7 square feet per capita and rents averaging $111/month. With nearly 3.4 million square feet in inventory, the city remains well positioned to support both its newcomer influx and a steady stream of local movers.
See the full breakdown of North Carolina’s self storage markets in the table below.
Self Storage Costs and Availability Across North Carolina’s Cities
| City | County | 2025 Total Self Storage Inventory | Sq. Ft./Capita | Self Storage Rent ($) |
|---|---|---|---|---|
| Charlotte, NC | Mecklenburg | 7,968,489 | 7.4 | 121 |
| Raleigh, NC | Wake | 4,907,660 | 7.6 | 116 |
| Greensboro, NC | Guilford | 3,845,885 | 11.2 | 95 |
| Durham, NC | Durham | 3,353,590 | 9.7 | 111 |
| Fayetteville, NC | Cumberland | 3,408,459 | 12.6 | 106 |
| Wilmington, NC | New Hanover | 3,105,440 | 14.4 | 125 |
| Winston Salem | Forsyth | 2,280,247 | 8.2 | 102 |
| Concord, NC | Cabarrus | 1,675,655 | 8.8 | 109 |
| Asheville, NC | Buncombe | 1,373,041 | 8.3 | 150 |
| Greenville, NC | Pitt | 1,263,708 | 10.2 | 106 |
| Cary, NC | Wake | 1,267,327 | 4.7 | 105 |
| Mooresville, NC | Iredell | 1,293,520 | 15.2 | 104 |
| Gastonia, NC | Gaston | 1,156,313 | 8.6 | 120 |
| Jacksonville, NC | Onslow | 1,198,482 | 10.6 | 154 |
| High Point, NC | Guilford | 1,139,103 | 6.9 | 114 |
| Goldsboro, NC | Wayne | 987,653 | 14.8 | 133 |
| Wake Forest, NC | Wake | 932,148 | 7.3 | 131 |
| Rocky Mount, NC | Nash | 845,764 | 12.5 | 111 |
| Apex, NC | Wake | 809,835 | 5.7 | 115 |
| Hickory, NC | Catawba | 808,734 | 8.9 | 90 |
| New Bern, NC | Craven | 793,442 | 14.5 | 125 |
| Burlington, NC | Alamance | 779,561 | 7.8 | 104 |
| Garner, NC | Wake | 715,658 | 4.9 | 129 |
| Hendersonville, NC | Henderson | 712,091 | 10.1 | 128 |
| Monroe, NC | Union | 634,247 | 7.8 | 100 |
| Cornelius, NC | Mecklenburg | 608,696 | 9.0 | 134 |
| Leland, NC | Brunswick | 591,348 | 16.3 | 140 |
| Winterville, NC | Pitt | 585,830 | 9.6 | 110 |
| Matthews, NC | Mecklenburg | 585,518 | 4.6 | 114 |
| Wilson, NC | Wilson | 556,708 | 10.9 | 86 |
| Huntersville, NC | Mecklenburg | 548,404 | 4.3 | 127 |
| Sanford, NC | Lee | 517,053 | 12.6 | 126 |
| Fuquay-Varina, NC | Wake | 488,077 | 7.4 | 125 |
| Statesville, NC | Iredell | 486,492 | 10.3 | 95 |
| Indian Trail, NC | Union | 481,942 | 6.1 | 124 |
| Thomasville, NC | Davidson | 477,020 | 9.0 | 89 |
| Pineville, NC | Mecklenburg | 475,101 | 3.7 | 127 |
| Newton, NC | Catawba | 438,980 | 11.8 | 70 |
| Kernersville, NC | Forsyth | 437,827 | 8.5 | 128 |
| Elizabeth City, NC | Pasquotank | 522,017 | 16.5 | 144 |
| Chapel Hill, NC | Orange | 416,120 | 7.6 | 122 |
| Salisbury, NC | Rowan | 411,195 | 7.1 | 121 |
| Clayton, NC | Johnston | 391,759 | 6.1 | 141 |
| Mebane, NC | Alamance | 391,531 | 11.0 | 125 |
| Arden, NC | Buncombe | 375,912 | 8.1 | 127 |
| Shelby, NC | Cleveland | 367,072 | 10.1 | 111 |
| Holly Springs, NC | Wake | 377,367 | 5.4 | 122 |
| Havelock, NC | Craven | 329,462 | 36.9 | 98 |
| Lenoir, NC | Caldwell | 315,622 | 10.9 | 136 |
| Boone, NC | Watauga | 309,875 | 9.8 | 123 |
| Morrisville, NC | Wake | 290,623 | 2.4 | 113 |
| Lumberton, NC | Robeson | 280,817 | 11.2 | 117 |
| Roanoke Rapids, NC | Halifax | 267,347 | 10.4 | 102 |
| Spring Lake, NC | Cumberland | 255,749 | 9.1 | 138 |
| Southern Pines, NC | Moore | 238,648 | 6.2 | 165 |
| Clemmons, NC | Forsyth | 236,189 | 5.5 | 120 |
| Harrisburg, NC | Cabarrus | 227,396 | 2.8 | 116 |
| Belmont, NC | Gaston | 224,910 | 4.1 | 161 |
| Knightdale, NC | Wake | 222,050 | 4.1 | 131 |
| Morganton, NC | Burke | 221,404 | 6.5 | 124 |
| Reidsville, NC | Rockingham | 217,769 | 10.8 | 105 |
| Lincolnton, NC | Lincoln | 217,504 | 6.6 | 121 |
| Asheboro, NC | Randolph | 213,800 | 4.6 | 123 |
| Smithfield, NC | Johnston | 210,855 | 10.7 | 103 |
| Henderson, NC | Vance | 206,018 | 9.8 | 133 |
| Eden, NC | Rockingham | 204,809 | 10.5 | 106 |
| Graham, NC | Alamance | 198,862 | 3.8 | 116 |
| Wendell, NC | Wake | 197,831 | 6.8 | 132 |
| Waxhaw, NC | Union | 194,941 | 2.5 | 166 |
| Hubert, NC | Onslow | 167,476 | 7.8 | 121 |
| Kinston, NC | Lenoir | 166,553 | 6.1 | 129 |
| Mint Hill, NC | Mecklenburg | 163,418 | 2.7 | 133 |
| Carrboro, NC | Orange | 157,782 | 2.6 | 111 |
| Hope Mills, NC | Cumberland | 131,793 | 2.1 | 120 |
| Kings Mountain, NC | Cleveland | 130,364 | 7.0 | 98 |
| Kannapolis, NC | Cabarrus | 128,981 | 1.8 | 84 |
| Laurinburg, NC | Scotland | 127,027 | 6.6 | 95 |
| Candler, NC | Buncombe | 121,829 | 5.6 | 106 |
| Waynesville, NC | Haywood | 116,080 | 5.7 | 121 |
| Mount Holly, NC | Gaston | 110,327 | 3.0 | 105 |
| Archdale, NC | Randolph | 74,448 | 2.7 | 62 |
| Albemarle, NC | Stanly | 110,234 | 7.3 | 87 |
| Davidson, NC | Mecklenburg | 65,284 | 2.1 | 161 |
| Rolesville, NC | Wake | 134,223 | 2.9 | 189 |
| Lexington, NC | Davidson | 56,890 | 2.7 | 118 |
| Elon, NC | Alamance | 40,975 | 1.0 | 91 |
| Pinehurst, NC | Moore | 25,792 | 3.2 | 116 |
Conclusion
Migration trends have become a real-time snapshot of North Carolina’s economic evolution. Gen Z renters, millennial buyers, and retiring baby boomers are steering growth toward counties like Pitt, Wake, and Orange. At the same time, Fayetteville, Asheville, and Winston-Salem watch more residents leave than arrive — reminders that growth across the state remains uneven. Together, these moves are quietly changing local housing markets, downtown skylines, and the state’s long-term identity.
Methodology
This analysis was conducted by StorageCafe, an online platform that offers nationwide storage unit listings.
In this report, we ranked all North Carolina counties based on net migration figures, calculated by subtracting the number of departures from the total number of move-ins for each location.
The migration data, along with information on income levels, homeownership rates, employment status, educational attainment and other demographic details of movers across the country were sourced from the U.S. Census American Community Survey PUMS 5-year, 2023.
Median home prices were derived from 2023 owner-occupied housing unit values reported by the U.S. Census. Rental data was also obtained from the 2023 U.S. Census American Community Survey.
Fair use and distribution
This study serves as a resource for the general public on issues of common interest and should not be regarded as investment advice. The data is true to the best of our knowledge but may change if amendments to it are made. We agree to the distribution of this content, but we do require a mention in return for attribution purposes.


Sweatshirt Storage Ideas Worth Keeping Up Your Sleeve
Sweatshirts are great until you realize how much room they take up. A few thick hoodies can fill a drawer fast, with lighter crewnecks getting squashed underneath or pushed somewhere you forget about. Good sweatshirt storage can make that pile much easier to manage without requiring a bigger closet.
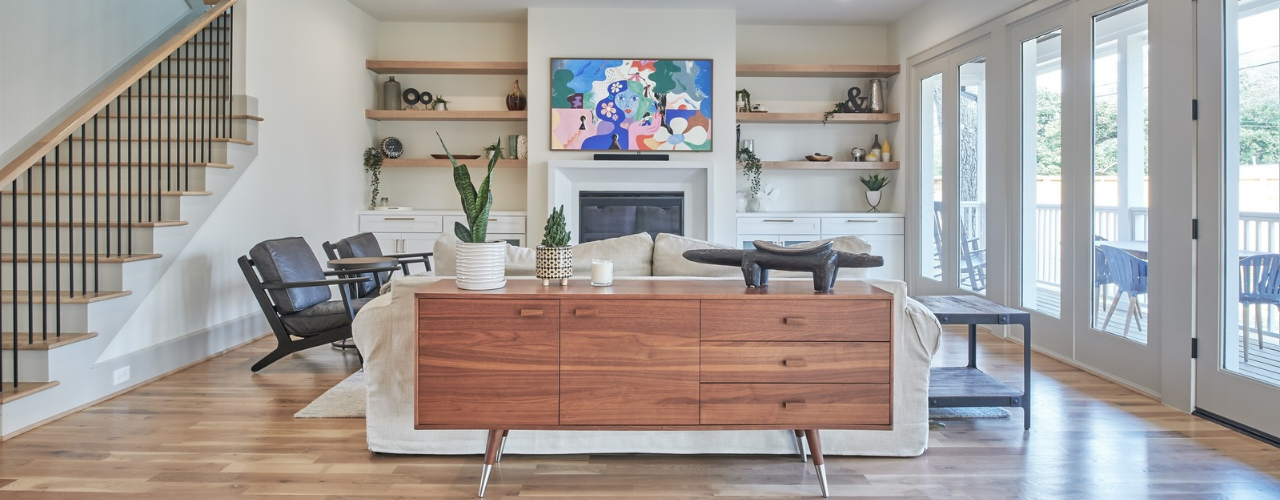
Living Room Storage Ideas: 28 Ways to Reclaim Your Hosting Space
If a living room is where most of a household’s living happens, good storage should be the top priority for setting up or revamping the place. After all, think of how easier it would be to have people over when tidying up the place is just a matter of putting things in their right place (in a time when fewer and fewer people are entertaining friends at home(opens in new tab)). The trick is making room for all those wayward clothes, blankets, chargers and other small things that end up on (or, inexplicably, in) the sofa. Here are 28 living room storage ideas to get you started and make tidying up a quick affair.
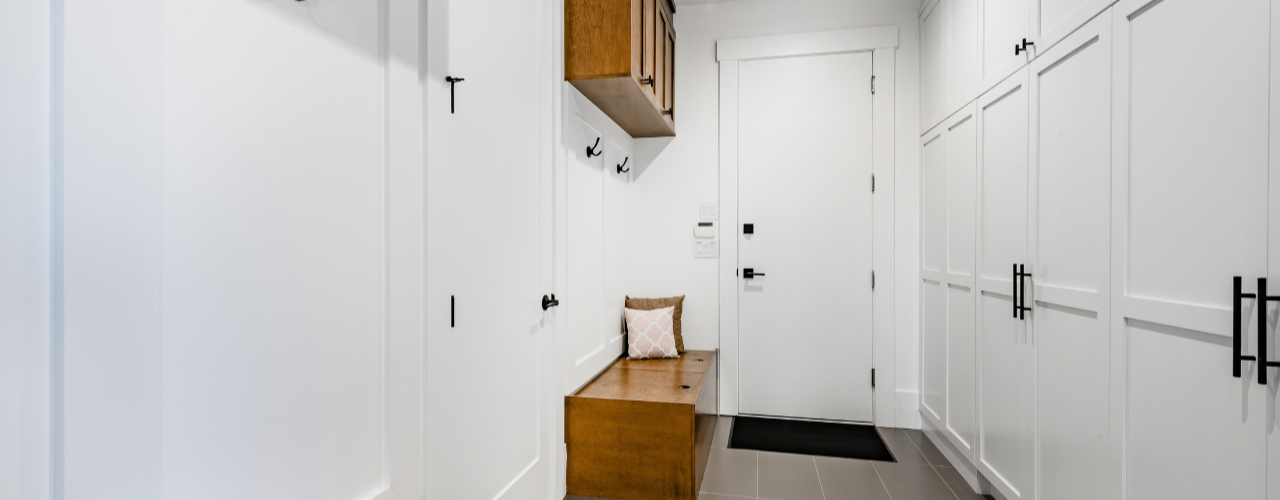
25 Mudroom Storage Ideas (And Mistakes to Avoid)
When you come home with muddy boots, an armful of bags and a coat you can’t wait to take off, it’s nice to have somewhere to put it all. With a mudroom, you can leave the outdoor mess at the door instead of carrying it through the house. Traditionally, you’d set aside a separate room, but you can just as easily use a hallway, an entryway closet, a laundry-room corner or a stretch of wall near the entrance.

Is Your Home Office Worth the Rent? What Coworking and Self Storage Could Save You
Every square foot of your apartment comes with a price tag, and a home office claims more of them than most renters expect. It starts with a desk. Then come the second monitor, the printer, the filing cabinet and the overflow boxes. Before long, the corner you set aside for work has turned into a small room you are paying for every month.

Best U.S. Cities to Live Uncluttered: Plano, TX, Offers the Most Room to Breathe
Clutter is in our homes as much as in our heads. Both are shaped by where we live.

America’s Top Snowbird Destinations for 2026–2027: Florida Leads in Numbers, Texas Wins on Value
For Americans living in colder states, the approach of winter is reason enough to start looking south. Cold weather carries costs that go beyond the heating bill and shoveling snow. Seasonal affective disorder(opens in new tab) is far more prevalent in northern states, so a temporary move south isn’t simply an escape from the cold, but a chance to spend the hardest stretch of winter outdoors and in the sun.

How Much Does Halloween Really Cost in 2026? Plan Wisely to Avoid the Scare of Hidden Costs
Americans’ love for Halloween is almost frightening — this year alone, we are on our way to spending $13.5 billion, according to data from the National Retail Federation(opens in new tab). That breaks down to about $115 Halloween costs per person, a whopping 49% more than 10 years ago.

How to Store LEGOs: All the Fun, None of the Clutter
How to store LEGOs largely comes down to how your household uses them. If the bricks are part of everyday play, you need a setup that keeps them within easy reach and makes cleanup quick (for your feet’s sake, at least). Toy storage(opens in new tab) such as simple bins, playmats or containers that children can put away themselves may be enough. Larger or more serious collections usually need more organization, such as labelled drawers for loose pieces, trays for unfinished builds, shelves for completed models and separate storage for retired sets.

Cardboard Costume Guide: Tips and Ideas for a DIY Halloween
Whether for kids or adults, cardboard costume ideas often make the biggest splash once materialized, and that’s for a simple reason: doing a lot with a little is a universally impressive feat (especially in this economy). If you don’t have enough boxes you could temporarily repurpose, don’t worry! There are many places where you can find free moving boxes(opens in new tab), from stores and supermarkets to online groups and recycling drop-off spots. On the run? Try your luck at a self storage(opens in new tab) facility that sells moving supplies, often for cheap. This way, you can choose moving boxes of different shapes and sizes(opens in new tab), so you can make your costumes as complex as you want.