
When it comes to self storage, the hard part is finding data that’s both current and retrospective, both granular and sweeping, but also — and most importantly — trustworthy enough to act on. After all, national averages age quickly, and the numbers that move decisions live at the metro and submarket level. Regularly refreshed and highly authoritative, StorageCafe’s Self Storage Industry Trends page exists to close that very gap for professionals in the self storage sector, as well as real estate reporters and journalists. It brings live, nationwide market data into one place and breaks it down city by city, drawing on the same intelligence the professional side of the business relies on. Here’s what it covers and why it’s worth keeping open in a tab.
A national snapshot that keeps pace with the market
The industry statistics page gives you the state of U.S. self storage, refreshed every month rather than published once and left to age. It tracks total inventory across the country, new rentable space delivered in the most recent year, and the volume of construction projected to come online next — including the year-over-year direction of the development pipeline, which has been easing from its recent peak.
Alongside supply, the page tracks the demand side: the share of Americans currently using self storage, the share who expect to rent in the future, and the scale of monthly search interest in storage nationwide. These figures explain a market that has kept absorbing new supply even as the construction pace moderates.
What you can explore on the industry statistics page
The page is more than a set of headline figures. It’s organized into sections that each answer a different question about the market, most of them paired with clear, interactive visuals that make the trends easy to read:
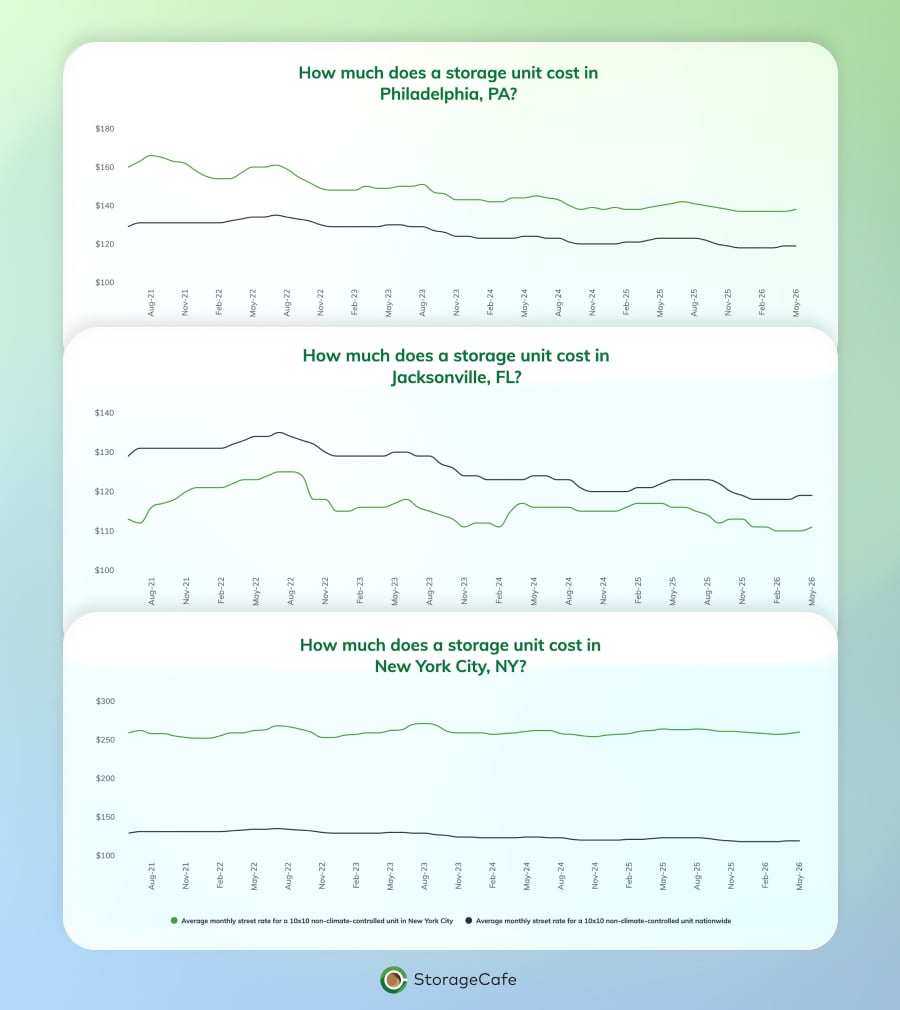
- Rent evolution in major cities — how street rates have moved over time across the country’s largest markets, so you can see the direction of travel rather than just a single point in time. For even more information on this topic, you can check out our storage price guide.
- Construction trends — what’s been delivered, what’s in the pipeline, and how the pace of new supply is shifting year over year, both nationally and by market.
- How many self storage facilities are there in the U.S.? — a running count of facilities and inventory across the country, the baseline figure behind almost every other metric on the page.
- Self storage customer profile — who is renting, drawn from demand research, including the life stages and circumstances that bring people to storage in the first place.
- Self storage interest (how customers search for storage online) — what search behavior reveals about where and when demand is building, often ahead of the moves that show up in rent and occupancy data.
- Expert insights on the self storage market — perspective from people active in the sector, adding the read-between-the-lines context that raw figures can’t supply on their own.
Together these turn the page from a reference table into something you can interpret — the visuals do a lot of the work of showing a trend rather than asking you to reconstruct it from numbers.
City-level pages built for submarket analysis
The national view sets context, but almost no decision gets made at the national average. What matters is the metro — and that’s where the page’s local pages do the work. Each major market has its own dedicated trends page covering current street rates by unit size, the count of facilities and units in the market, square feet of storage per capita, and the volume of new space scheduled to deliver, with year-over-year movement on each.
The local data is sourced from Yardi Matrix, StorageCafe’s sister company and one of the most comprehensive market-intelligence platforms in commercial real estate, used by investors, lenders, and asset managers underwriting the multifamily, office, industrial, and self storage sectors. Yardi Matrix maintains operational profiles for more than 40,000 self storage facilities across the U.S., so the figures behind these pages carry the same provenance as the data used to underwrite deals.
This diversity across different markets led us to also create pages dedicated to the self storage industry in the biggest U.S. cities:
- New York City — a dense, supply-constrained market with low square footage per capita, where tight inventory sustains premium rents.
- Houston — a deep, well-supplied market with high per-capita inventory and a large forward construction pipeline.
- Los Angeles — an aggressive recent build-out paired with one of the lowest per-capita supply figures among major metros, a combination worth watching for absorption.
The throughline is the balance between local demand and local supply, and the per-capita and pipeline figures on each page are what let you judge whether a given submarket is tightening or loosening. That’s the read that informs an acquisition, a development go/no-go, or a rate strategy — and it’s now in one consistent format across markets.
How the page fits into a market overview
The pages are organized so you can move from national context to a specific market quickly, then pull the comparison points you need.
For anyone tracking demand drivers, the StorageCafe Blog pairs the trends page with deeper research — studies on migration patterns, the life events behind storage demand, and sector reports covering specialized storage such as RV, boat, and car. Those pieces add the “why” behind the movements the page quantifies, which is often the part that’s hardest to source elsewhere.
Frequently asked questions
Where does the data come from?
The market figures are compiled by the StorageCafe Newsroom and sourced from Yardi Matrix, StorageCafe’s sister company and one of the most comprehensive market-intelligence platforms in commercial real estate. Yardi Matrix maintains operational profiles for more than 40,000 self storage facilities across the U.S., which is what gives the numbers their depth and reliability.
How often is it updated?
Data on self storage rents and construction is updated every month.
The page is designed to track the market as it moves rather than capture a single moment, so the figures refresh on an ongoing basis rather than being published once a year.
What can I see for a specific market?
Each city page covers current rates by unit size, the number of facilities and units in the market, square feet of storage per capita, and the volume of new space scheduled to deliver — with the year-over-year direction on each. Together those tell you whether a market is tightening or loosening.
How do I find the markets I care about?
City pages are organized by state and metro under the main trends page, so you can move between markets directly. Start from the Industry Trends page and drill into any city from there.
———————————————-
The market intelligence that used to be locked inside paid reports is now organized, current, and consistent across markets in one place. The national page frames where the sector sits; the city pages tell you what’s true in the markets you operate, build, or invest in; and the underlying Yardi Matrix provenance means the figures hold up to scrutiny. Start with the markets you cover and build the read from there.


StorageCafe Now Has a Dedicated Storage Unit Price Guide
If you’ve ever tried to figure out whether a storage quote was fair, you know the problem. You see a monthly rate, but you have no way to tell whether it’s a deal, a premium-level price, or right in line with the market — and pricing tools that give you real context are surprisingly hard to find.

StorageCafe’s Industry Trends Page: A Sharper Look at the Market
When it comes to self storage, the hard part is finding data that’s both current and retrospective, both granular and sweeping, but also — and most importantly — trustworthy enough to act on. After all, national averages age quickly, and the numbers that move decisions live at the metro and submarket level. Regularly refreshed and highly authoritative, StorageCafe’s Self Storage Industry Trends page exists to close that very gap for professionals in the self storage sector, as well as real estate reporters and journalists. It brings live, nationwide market data into one place and breaks it down city by city, drawing on the same intelligence the professional side of the business relies on. Here’s what it covers and why it’s worth keeping open in a tab.

Scuba Gear Storage Guide: Keep Your Kit Dive-Ready
The best way to store scuba gear is in a cool, dry, shaded space where equipment can hang or lie flat without compression. Salt residue, moisture, heat and UV exposure are the main causes of premature breakdown in neoprene, rubber and metal components. Rinsing thoroughly after every dive and allowing everything to dry completely before storage prevents most long-term damage.

Large Storage Units Explained: How to Know What Size You Need
Large storage units start at the 10’x20’ and climb from there. The 10’x20’ is the most common — the familiar lock-up garage you see at nearly every facility. Above it sit the 10’x30’, 20’x20’, and 20’x30’ plus specialist spaces for storing boats, RVs and commercial equipment.

How StorageCafe’s Boat Storage Directory Helps You Find the Right Space
You’d think finding boat storage would be straightforward. Type something into Google, get a list of nearby facilities, pick one. In practice, it rarely works that way. Most search results surface generic self-storage pages where the largest unit tops out at 10’×10’ — fine for a couch, useless for anything on a trailer. You end up calling around just to find out who takes boats.

Best RV Destinations in the U.S. (2026): Oceanfront Drives Beat America’s Usual RV Favorites
A new kind of traveler is reshaping the RV campground: younger, plugged in and rarely fully off the clock.
")
How to Store a Boat in Self Storage: Types, Costs & What to Look For
Storing a boat in self storage comes down to four decisions: how far the facility is from your launch point, what type of storage suits your climate (outdoor, covered, or indoor), how to prepare the boat before storing it, and whether the facility’s security and access hours fit how you use your boat. First-time owners who think through these factors before signing a lease tend to get significantly more use out of their boat.

Temporary Storage During Emergencies: What to Know Before You Need It
When a hurricane’s bearing down, a wildfire is closing in, or floodwater has already reached your front door, the last thing you want to be doing is figuring out where to put your stuff – but that’s exactly when people find themselves scrambling for temporary storage.

How to Store Sweaters
Knowing how to store sweaters correctly — folded flat, kept in breathable containers and away from moisture — is what separates a knit that lasts a decade from one that pills or gets eaten alive by moths after a single season.