Behind The Roll-Up Doors: REITs Expand To Own A Third Of The Self Storage Market


Key Takeaways
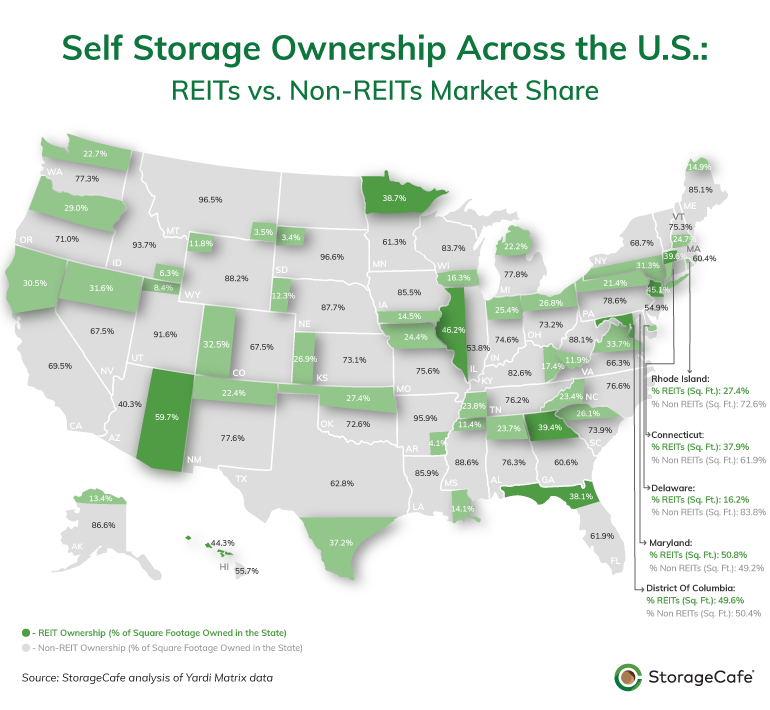
- Real estate investment trusts (REITs) now account for about 30% of the self storage market. For every REIT-owned facility, approximately two are owned by non-REIT companies and mom-and-pop operators.
- Non-REIT ownership dominates in most areas, except for Maryland, where REITs control 50.8% of the self storage inventory. Washington, D.C., and Illinois follow closely, with REITs owning 49.6% and 46.2% of total inventory, respectively.
- While street rates are generally aligned across REIT and non-REIT properties, REIT-owned facilities have seen prices drop slightly faster on a national level, with a 4.9% year-over-year decrease compared to a 3.6% decrease for non-REIT properties.
- REIT-owned facilities often come with perks like standardized pricing and cost-saving benefits, though higher rents may apply when catering to specialized needs.
- Hawaii stands out with the highest rents at REIT-owned properties, averaging $281 per month — nearly 110% above the national average. This steep pricing is driven by low supply (3.58 square feet per capita) and high demand in tourist-heavy areas, where limited space intensifies the impact of scarcity on pricing.
What began as a modest family business in a small Texas town has, over the last 60 years, grown into a $20.53 billion industry, boasting over 2 billion square feet of rentable space across the U.S. With demand for space growing amid increasing urbanization trends, rising home prices and evolving storage needs, the self storage sector attracted the attention of institutional investors, gradually minimizing the gap between traditionally owned properties and real estate investment trusts (REITs).
While much of the self storage inventory is still owned by local companies and small operators, self storage REITs are emerging as key players, bringing substantial benefits to consumers. By tapping into large capital reserves, REITs provide dependable, cost-effective storage options tailored to modern consumer needs.
As of September 2024, there are nearly 2 billion rentable square feet of self storage space in the U.S. Of this, 30.5% is owned by REITs — amounting to roughly 593 million square feet across more than 8,400 properties. Nationwide, self storage per capita hovers around 7.3 square feet per person.
Using insights from the Yardi Matrix database, we drilled down into market composition to pinpoint the areas most appealing to REITs and how their offerings stack up against the broader market in terms of affordability. We took into account space owned by the top four REITs in U.S. self storage — Public Storage, Extra Space Storage, CubeSmart and National Storage Affiliates — along with U-Haul Holding Company. We also compared these figures to the space owned by non-REIT operators and analyzed rental rates to identify pricing trends.
At the city level, a long-standing trend shows major players targeting large urban areas with strong storage demand. High population density and limited residential space make cities like Dallas, TX (62%), Chicago, IL (59%), Baltimore, MD (58%), and Washington, DC (50%) stand out, with REITs owning a significant share of the local storage market..
But it’s not just about population size. REITs also prioritize cities with rapid population growth or high migration rates, where storage needs tend to increase during moves and transitions. For example, cities like Gilbert, AZ (67%), North Charleston, SC (67%), and Fort Worth, TX (51%)—which have seen significant housing growth over the past two decades—are also leading in REIT ownership of self storage facilities.
REITs Shine on the East Coast: Maryland, DC, and New Jersey Lead the Way at the State Level
The same trend holds true at a macro level. Just as urban areas with dense populations and limited residential space attract REITs, certain regions, like the East Coast, also offer the right mix of factors to make them prime markets for self storage. REITs have a significant presence along the Atlantic Seaboard, where higher housing prices, smaller apartments and steady population growth create ideal conditions for storage demand. States like Maryland and the District of Columbia lead the way, with REITs controlling close to or over half of the storage inventory. Larger states such as Florida and Georgia add to the picture, combining population growth with vast storage capacities.
Curious about which states have the highest REIT presence? Here’s a quick look at the areas most attractive to REITs and what makes them appealing from a self storage operational standpoint.
1. Maryland
REIT-owned square footage: 16M
Share of REIT-owned storage space in total local inventory: 50.8%
Maryland stands out as a prime example of REIT dominance as it holds the edge in terms of inventory ownership. More than 50% of the total rentable square footage in Maryland is owned by REITS, holding a footprint of over 16.4M square feet. This balance mirrors the state’s high urban demand and tight property availability, with the current housing market indicating signs of a seller’s market.
One key driver behind the REIT expansion in The Old Line State is the state’s flourishing technology sector. In fact, for every 1,000 residents, 54 people work in the tech industry. Additionally, with 24% of tech workers working remotely, the opportunity for storage solutions to thrive among residents and businesses alike is healthily nourished here.
Maryland’s below-average self storage per capita of 6.05 square feet indicates an undersupplied market, which is one of the factors that keep local prices high compared to other states, all while attracting investor interest. Although average monthly rent in REIT properties fell 4.4% year-over-year to $153, these facilities still command a slight premium over their non-REIT counterparts, which average $145.
Zooming in on Maryland's major urban hubs, REITs control 57.5% of the self storage stock in Baltimore, 64% in Columbia, and 100% in Germantown. Meanwhile, Waldorf and Frederick buck the trend, with non-REIT operators dominating the local market.
2. Washington, D.C.
REIT-owned square footage: 1M
Share of REIT-owned storage space in total local inventory: 49.6%
With the second-highest cost of living in the nation, D.C. puts residents in a housing squeeze, often prompting them to seek storage space away from home rather than upsizing. Additionally, the city’s robust health care sector and abundant government job opportunities keep rent rates high, further driving self storage adoption — and some of the highest price tags in the country.
In D.C., REITs account for approximately 1 million square feet of inventory, representing 49.6% of the total local supply.
Self storage, however, remains a hot commodity in DC, with only 2.16 square feet of space available per capita. This limited inventory drives a competitive market, with storage rates averaging $174 per month.
3. Illinois
REIT-owned square footage: 27M
Share of REIT-owned storage space in total local inventory: 46%
As urbanization and population growth continue, Illinois faces a significant gap in sufficient space — an opportunity that storage operators are actively seizing. Investors have been working to bridge this gap, with the Chicago-Naperville-Elgin metro area now ranking among the top 10 U.S. metros for self storage development. However, there is still substantial room for growth as Illinois’s existing inventory stands at just 5.5 square feet per capita, well below the national benchmark.
Currently, nearly 27 million square feet of the state’s self storage inventory is REIT-owned, accounting for roughly 46% of the total. Non-REIT properties hold a larger share, comprising 31.2 million square feet.

Chicago’s self storage market is heavily influenced by REITs, which own 59% of the inventory, totaling nearly 7 million rentable square feet. This strong presence contributes to a more relaxed pricing scene, with units at REIT-owned facilities averaging $130 per month—about 11% more affordable than non-REIT options.
In Naperville, where the market is naturally smaller, REITs dominate with control of 75% of the storage capacity. With population growth and a severe shortage of just 2.81 square feet per person, new developments are emerging to address the demand. One such project on 75th Street will include a Class A self storage facility as part of a mixed-use development featuring a childcare center and a drive-thru coffee shop. The new facility will be managed by Cubesmart.
4. New Jersey
REIT-owned square footage: 20M
Share of REIT-owned storage space in total local inventory: 45%
With tight living spaces and a pricey real estate scene, New Jersey emerges as a pricey self storage market and attracts the fourth-largest presence of REIT-owned properties. REITs control 45% of the storage market with nearly 20M square feet of rentable storage space.
New Jersey’s high demand for space, driven by its status as the most densely populated state in the U.S. creates a favorable environment for storage facilities to emerge and thrive — especially as local supply struggles to keep up with demand. With a self storage capacity of just 4.18 square feet per capita, the state faces an ongoing undersupply, paving the way for higher rents. Prices in New Jersey exceed the national average, with local storage units now renting for $156 per month on average.
In New Jersey, REITs are shifting their focus toward smaller markets, with significant ownership stakes in cities like Hoboken and New Brunswick, where they control the majority of the self storage inventory. In Toms River, REIT ownership reaches an impressive 57%.
On the other hand, larger cities like Newark and Jersey City remain dominated by mom-and-pop operators and smaller companies.
5. Hawaii
REIT-owned square footage: 1.3M
Share of REIT-owned storage space in total local inventory: 44%
Hawaii offers a lucrative market for all self storage owners, with the state being the second-most undersupplied nationally after D.C., with only 3.6 square feet of space per capita.
Non-REITs hold 55.7% of the existing self storage inventory in the state. Meanwhile, REIT-owned properties account for approximately 1.3 million square feet across 20 facilities, representing 44.3% of the total storage space.
Hawaii’s self storage sector boasts the highest rents nationwide. REIT-owned properties average $281, while non-REIT facilities are more affordable. The 12% price difference can be attributed to REITs targeting the high-end market, particularly in Honolulu, where land constraints and strong tourist demand push property values higher.
REITs are strategically targeting smaller markets like Pearl City and Waipahu, as the low storage per capita—2.55 for Pearl City and 1.66 for Waipahu—presents opportunities for growth. Waipahu in particular is undergoing significant transit-oriented development (TOD) initiatives aimed at enhancing livability, which is expected to further increase the demand for storage solutions.
6. Arizona
REIT-owned square footage: 19M
Share of REIT-owned storage space in total local inventory: 40%
Arizona has been a top destination for migration for quite a while now, particularly from states like California, with newcomers seeking more affordable living options. This influx has spurred both residential and commercial real estate development. In fact, Phoenix was recently ranked the third-best-performing city for real estate development in the past almost 50 years.
With such rapid growth, the need for storage solutions has increased significantly, and Arizona’s self storage sector has delivered. Currently, the state outpaces the national average, benefitting from 8.7 square feet of space per capita.
Though non-REITs lead, REITs capture a little over 40% of the market’s square footage, amounting to 19M square feet of space.
Both types of self storage ownership offer competitive prices in Arizona, largely due to the state’s robust supply. REITs, however, are typically better positioned to provide attractive deals, with street rates averaging around $127 — about 3% higher than those at non-REIT facilities. Additionally, REIT-owned unit prices in Arizona have dropped by 5.2% year-over-year, outpacing the 3% decline seen at mom-and-pop facilities.

One of the largest cities in Arizona, Gilbert, sees about 67% of its 2.3M square feet total inventory dedicated to REIT ownership.
With robust population growth and economic strength, Mesa and Phoenix have become hotspots for institutional investors, with 46% and 44% of their respective rentable self storage inventory owned by REITs.
7. Massachusetts
REIT-owned square footage: 12M
Share of REIT-owned storage space in total local inventory: 40%
As the third-most densely populated state in the U.S., with over 840 people per square mile, Massachusetts offers a conducive backdrop for storage solutions to succeed given the common challenge of restricted living spaces plus a large student population.
The market composition reflects the state’s urban character, with big players interested in getting a considerable piece of the pie. REITs hold about 11.6M square feet of space in Massachusetts, amounting to 39.6% of the state’s inventory of 29M square feet.
In line with national trends of declining prices, both REIT and non-REIT facilities in Massachusetts have experienced year-over-year price drops of approximately 3.5%. However, mostly due to the Bay State’s low inventory of only 4.6 square feet per capita, self storage rates remain well above the national values. Average monthly rates stand at $168 for non-REITs and $159 for REIT facilities.
Turning to Boston, the city reflects the state’s challenges with tight living conditions and limited space. REITs dominate the local storage market, owning 64% of the inventory with rates averaging $208 per month—13% lower than non-REIT facilities. However, with just 0.7 square feet of self storage per capita and high demand for extra room, rental rates in Boston are 54% higher than the national average.
8. Georgia
REIT-owned square footage: 29M
Share of REIT-owned storage space in total local inventory: 40%
Georgia has been seeing significant population and economic growth for a while now. Home to 19 Fortune 500 companies and with almost 62K net newcomers moving here last year alone according to the U.S. Census, the self storage sector is in high demand in the Peach State.
Of the total 72.5 million square feet of storage space in the state, REITs own 28.6 million square feet, accounting for 39% of the local inventory.
The abundant supply — approximately 9.5 square feet per capita — helps keep prices in check for both REIT and non-REIT operators. REIT-owned storage units currently rent for an average of $117 per month, reflecting a 10% year-over-year decline in rental rates.
Georgia's largest city, Atlanta, leads the state in REIT presence, with 3.2 million square feet—more than half of its 5.6 million square feet of rentable inventory—owned by REITs. However, unlike the broader state trend, Atlanta faces an undersupply of self storage, offering just 4.54 square feet per capita. This scarcity drives prices for REIT-operated facilities to $157 per month, a full $40 higher than the state average.
9. Minnesota
REIT-owned square footage: 9M
Share of REIT-owned storage space in total local inventory: 39%
With 34% of its workforce working remotely, Minnesota is seeing a growing demand for self storage space. The state’s total inventory amounts to 24 million square feet, translating to approximately 6.6 square feet per capita. REITs account for 9.2 million square feet, representing nearly 39% of the total inventory.
REIT-owned properties, with more flexibility to offer competitive street rates and discounts, average lower monthly prices, at $112 compared to non-REIT facilities, where rates hover around $125 per month.
In Minneapolis, REITs own 732,000 square feet, representing nearly 39% of the city’s rentable storage space.
In contrast, Bloomington sees a higher REIT presence, with 50% of the storage market under their control. Despite an ongoing undersupply, street rates for REIT-owned units average $93, significantly lower than the $123 charged by non-REIT facilities.
10. Florida
REIT-owned square footage: 67M
Share of REIT-owned storage space in total local inventory: 38%
Florida, the top relocation destination in the country for Gen X, also ranks among the top 10 states for REIT-owned self storage inventory. With sunny weather and affordable living costs, it’s no surprise the Sunshine State is attracting newcomers of all ages and demographics — and with them, a growing demand for self storage.
With a total rentable square footage of 177 million, translating to 9.2 square feet per capita, Florida is a well-supplied market. REITs account for 67 million square feet, or 38% of the total inventory, with the remainder owned by smaller operators.
Pricing between REIT and non-REIT facilities shows a gap, with REIT-owned properties offering slightly more affordable rates, averaging $134 per month.
Located in the central Florida region, Tampa and Orlando exhibit similar trends in the self storage market, with REIT ownership at 57% and 54%, respectively, underscoring their interest in urban environments characterized by high tourism and substantial population traffic. Both neighboring cities maintain a healthy supply of approximately 7 square feet per capita, with rental rates for REIT owned facilities averaging $129 in Tampa and $121 in Orlando.
Self storage rents fall, with REIT-owned facilities offering bigger discounts
Street rates for self storage currently average around $1.11 per square foot across the U.S., with REIT-owned facilities generally aligning with broader market trends. However, in high-demand areas, rates may rise due to added amenities such as enhanced security, climate control, streamlined payment systems and specialized storage options like boat and RV spaces — all designed to enhance the customer experience.
In positive news for renters, street rates have generally been declining across the U.S. as demand stabilizes post-pandemic and competition for space eases. Interestingly, REIT-owned facilities have seen rents drop faster, with a year-over-year decline of nearly 4.9% compared to a 3.6% decrease in non-REIT properties.
The self storage market in the U.S. is diverse, with non-REITs dominating 70% of the market and REITs accounting for the remaining 30%.
Local preferences, urban density and economic trends play big roles in shaping this landscape. Both types of operators bring their own strengths to the table — REITs often stand out with features like enhanced security and cutting-edge technology, while non-REITs tend to focus on personalized service and a more classic approach.
REIT vs. Non REIT Self Storage Ownership by State
| Rank | State | Total Inventory (sq. ft.) | REIT-Owned Inventory (sq. ft.) | REIT Market Share (%) | Non-REIT Inventory (sq. ft.) | Non-REIT Market Share (%) | Avg. Street Rate ($) | Storage Space per Capita (sq. ft.) |
|---|---|---|---|---|---|---|---|---|
| 1 | Maryland | 32,314,530 | 16,401,729 | 50.8% | 15,912,801 | 49.2% | $155 | 6.05 |
| 2 | District Of Columbia | 2,010,302 | 997,661 | 49.6% | 1,012,641 | 50.4% | $176 | 2.16 |
| 3 | Illinois | 58,011,489 | 26,774,558 | 46.2% | 31,236,931 | 53.8% | $134 | 5.54 |
| 4 | New Jersey | 44,325,663 | 19,974,780 | 45.1% | 24,350,883 | 54.9% | $165 | 4.18 |
| 5 | Hawaii | 2,866,397 | 1,270,110 | 44.3% | 1,596,287 | 55.7% | $258 | 3.58 |
| 6 | Arizona | 47,402,495 | 19,116,080 | 40.3% | 28,286,415 | 59.7% | $130 | 8.72 |
| 7 | Massachusetts | 29,416,033 | 11,642,011 | 39.6% | 17,774,022 | 60.4% | $169 | 4.58 |
| 8 | Georgia | 72,512,380 | 28,591,498 | 39.4% | 43,920,882 | 60.6% | $130 | 9.49 |
| 9 | Minnesota | 23,836,272 | 9,233,780 | 38.7% | 14,602,492 | 61.3% | $124 | 6.6 |
| 10 | Florida | 176,608,864 | 67,223,267 | 38.1% | 109,385,597 | 61.9% | $147 | 9.23 |
| 11 | Connecticut | 17,256,207 | 6,531,956 | 37.9% | 10,724,251 | 62.1% | $151 | 5.34 |
| 12 | Texas | 256,848,300 | 95,487,135 | 37.2% | 161,361,165 | 62.8% | $123 | 11.03 |
| 13 | Virginia | 53,757,688 | 18,112,494 | 33.7% | 35,645,194 | 66.3% | $146 | 8.03 |
| 14 | Colorado | 37,091,737 | 12,036,910 | 32.5% | 25,054,827 | 67.5% | $139 | 8.51 |
| 15 | Nevada | 32,013,763 | 10,122,892 | 31.6% | 21,890,871 | 68.4% | $131 | 11.38 |
| 16 | New York | 68,233,604 | 21,324,668 | 31.3% | 46,908,936 | 68.7% | $182 | 3.79 |
| 17 | California | 231,152,900 | 70,487,462 | 30.5% | 160,665,438 | 69.5% | $184 | 6.43 |
| 18 | Oregon | 25,122,228 | 7,290,885 | 29.0% | 17,831,343 | 71.0% | $147 | 8.47 |
| 19 | Oklahoma | 30,465,643 | 8,354,340 | 27.4% | 22,111,303 | 72.6% | $93 | 12.43 |
| 20 | Rhode Island | 5,271,501 | 1,444,212 | 27.4% | 3,827,289 | 72.6% | $157 | 4.95 |
| 21 | Kansas | 11,326,937 | 3,042,802 | 26.9% | 8,284,135 | 73.1% | $114 | 7.13 |
| 22 | Ohio | 55,671,918 | 14,909,521 | 26.8% | 40,762,397 | 73.2% | $107 | 6.36 |
| 23 | South Carolina | 37,154,577 | 9,685,226 | 26.1% | 27,469,351 | 73.9% | $123 | 10.21 |
| 24 | Indiana | 38,686,657 | 9,837,727 | 25.4% | 28,848,930 | 74.6% | $105 | 8.07 |
| 25 | New Hampshire | 9,810,425 | 2,419,612 | 24.7% | 7,390,813 | 75.3% | $142 | 9.7 |
| 26 | Missouri | 31,735,284 | 7,746,497 | 24.4% | 23,988,787 | 75.6% | $119 | 7.78 |
| 27 | Tennessee | 45,673,670 | 10,854,237 | 23.8% | 34,819,433 | 76.2% | $123 | 9.7 |
| 28 | Alabama | 29,232,630 | 6,932,825 | 23.7% | 22,299,805 | 76.3% | $112 | 11.23 |
| 29 | North Carolina | 75,777,840 | 17,720,368 | 23.4% | 58,057,472 | 76.6% | $119 | 9.91 |
| 30 | Washington | 51,045,647 | 11,593,938 | 22.7% | 39,451,709 | 77.3% | $158 | 8.31 |
| 31 | New Mexico | 11,391,346 | 2,550,628 | 22.4% | 8,840,718 | 77.6% | $114 | 9.47 |
| 32 | Michigan | 43,248,123 | 9,600,223 | 22.2% | 33,647,900 | 77.8% | $120 | 6.13 |
| 33 | Pennsylvania | 49,068,940 | 10,519,773 | 21.4% | 38,549,167 | 78.6% | $136 | 4.95 |
| 34 | Kentucky | 17,650,618 | 3,070,070 | 17.4% | 14,580,548 | 82.6% | $112 | 7.96 |
| 35 | Wisconsin | 25,398,122 | 4,143,860 | 16.3% | 21,254,262 | 83.7% | $118 | 8.11 |
| 36 | Delaware | 4,004,199 | 648,284 | 16.2% | 3,355,915 | 83.8% | $148 | 5.54 |
| 37 | Maine | 4,758,137 | 709,285 | 14.9% | 4,048,852 | 85.1% | $144 | 8.68 |
| 38 | Iowa | 10,276,430 | 1,491,995 | 14.5% | 8,784,435 | 85.5% | $102 | 7.4 |
| 39 | Louisiana | 33,161,805 | 4,670,380 | 14.1% | 28,491,425 | 85.9% | $129 | 10.61 |
| 40 | Alaska | 2,242,618 | 301,608 | 13.4% | 1,941,010 | 86.6% | $192 | 7.29 |
| 41 | Nebraska | 9,514,078 | 1,172,095 | 12.3% | 8,341,983 | 87.7% | $99 | 8.27 |
| 42 | West Virginia | 2,932,979 | 350,251 | 11.9% | 2,582,728 | 88.1% | $100 | 7.7 |
| 43 | Wyoming | 5,795,457 | 682,525 | 11.8% | 5,112,932 | 88.2% | $97 | 15.33 |
| 44 | Mississippi | 11,910,486 | 1,356,795 | 11.4% | 10,553,691 | 88.6% | $120 | 11.59 |
| 45 | Utah | 26,744,920 | 2,233,774 | 8.4% | 24,511,146 | 91.6% | $126 | 10.31 |
| 46 | Idaho | 15,914,120 | 1,007,190 | 6.3% | 14,906,930 | 93.7% | $103 | 17.69 |
| 47 | Arkansas | 18,635,202 | 763,360 | 4.1% | 17,871,842 | 95.9% | $104 | 14.45 |
| 48 | Montana | 15,721,658 | 556,523 | 3.5% | 15,165,135 | 96.5% | $100 | 24 |
| 49 | South Dakota | 7,135,724 | 245,064 | 3.4% | 6,890,660 | 96.6% | $101 | 14.01 |
Featured expert opinion
To better understand the factors influencing self storage REIT development nationwide, we spoke with a leading expert in the field.
Doug Ressler, Business Intelligence Manager at Yardi Matrix
Is there a correlation between self storage REIT ownership, population density and migration patterns across U.S. states?

Doug Ressler, Business Intelligence Manager at Yardi Matrix
There is a significant relationship between self storage REIT ownership and both population density and migration patterns across various U.S. states.
Self storage facilities tend to be more common in densely populated urban regions, where limited space creates a greater need for additional storage options. In these areas, high population density generally leads to increased demand for self storage solutions, making them appealing targets for REIT investments.
Migration patterns reveal that states with significant inbound migration, especially in the Sunbelt region (notably Texas, Florida, and Arizona), experience heightened demand for self storage. This surge is primarily driven by individuals relocating for employment, retirement, or lifestyle changes, who often require temporary storage solutions during their transitions.
Long-term demographic shifts, such as an aging population and decreasing household sizes, further fuel the demand for self storage. These trends are particularly evident in specific states and play a crucial role in guiding REIT investment decisions.
Overall, REITs strategically target regions with high population density and favorable migration trends to leverage the increasing need for self storage. This strategy enables them to achieve improved occupancy rates and enhanced rental income.
Methodology
This analysis was conducted by StorageCafe, an online platform providing nationwide storage unit listings across the U.S. The aim of this report was to examine the composition of the self storage market and the share of inventory owned by REITs.
The storage inventory, rental rate data and year-over-year growth featured in this report were sourced from Yardi Matrix, StorageCafe’s sister division and a business development and asset management tool for brokers, sponsors, banks and equity sources underwriting investments in the multifamily, office, industrial and self storage sectors.
Our analysis includes data from 49 states and Washington, D.C., with information broken down by state and city levels where data was available. Some areas were excluded due to insufficient data.
The information presented in this report is accurate to the best of our knowledge; however, it may be subject to changes or inconsistencies due to variations in data availability and coverage.
Fair use and distribution
This study serves as a resource for the general public on issues of common interest and should not be regarded as investment advice. The data is true to the best of our knowledge but may change if amendments to it are made. We agree to the distribution of this content, but we do require a mention in return for attribution purposes.


Best RV Destinations in the U.S. (2026): Oceanfront Drives Beat America’s Usual RV Favorites
The real difference between an ordinary RV stop and a standout trip often comes down to the campground or resort you choose.

Where to Donate Furniture in NYC (With Free Pick-Up Options)
Finding somewhere to donate furniture in NYC is more complicated than it should be. Not every organization accepts large items, pick-up availability is inconsistent, and the options that do exist aren’t always easy to find in one place. If you’re specifically hoping to donate furniture with free pick-up, the list of options gets even shorter.

Clean Out, Give Back: Where to Donate Clothes in Los Angeles
Few cities reinvent themselves like Los Angeles, and wardrobes tend to follow suit. Between changing seasons, evolving trends and an endless calendar of occasions worth dressing for, closets fill up fast, making the question of where to donate clothes in Los Angeles one that most Angelenos eventually find themselves asking.

How to Store Shoes Based on Your Personality
Your shoe closet is lying — not about how many pairs you own (that number is likely higher than you’d admit), but about who you are. The way you approach shoe storage, or avoid it, is one of the more honest reflections of your personality that exists in a home.

Tiny Home Storage Ideas for Every Nook and Cranny
Tiny home storage is one of those challenges that sounds straightforward until you’re standing in 200 square feet wondering where the winter coats are supposed to go. You didn’t downsize for the storage anxiety — you did it for the coziest place you’ve ever called home, a wallet that finally feels lighter, and a minimalist lifestyle that suits you just fine.

Best States for Electric Vehicles (2026): The West Leads EV Adoption, Oklahoma Speeds Up
Last updated: June 22, 2026.
")
Self Storage Discounts: Types, Tips and How to Get the Best Deals for Your Needs
When you start looking for a self storage unit to rent, one thing becomes clear very quickly: self storage discounts are a standard part of the industry. From introductory specials to military savings and online-only rates, operators frequently offer promotions designed to make renting a unit more affordable and flexible.

How Self Storage Can Help Event Planners
When you attend a great event, you rarely think about the choreography happening behind the curtain or after the last guest leaves. Unless, of course, you’re an event planner — an industry that has grown 8.6% per year on average over the five years between 2020 and 2025. It shows no signs of slowing down either, as small businesses and event planners continue to carve out their place across America.

Most Fun Cities In The U.S.: Miami & Orlando Rule The Fun Access Map, While Phoenix Reveals A Growing Leisure Divide
Are Americans going out less, or just living in places that make going out harder?